If you want to become a more profitable football gambler, you must have both a broad understanding of statistics and the ability to discern which numbers mean more than others. In this NFL and college football sports betting and strategy guide, I’ll lay out the roadmap for which numbers you should be following most closely. We won’t dive all the way into the nitty gritty, but if a specific metric catches your eye, deeper dives are coming (and will be linked within this post as they do).
NFL & College Football Betting & Strategy Guide: Key Offensive Stats

👉 Check Out the FREE Expert Picks »
The Free Picks on Tails are your shortcuts to smarter bets … no signup, no strings. Here you will find a bunch of FREE expert picks, updated daily.
NFL & College Football Betting & Strategy Guide Part 1. Offense
Let’s begin by talking about offense. Football is fundamentally a passing game; the best way to increase your odds of winning in almost all circumstances is by dropping back to pass. Despite what commentators may say about how teams who run a lot tend to win, it’s the passing offenses that build the lead allowing them to run the clock out that truly matter.
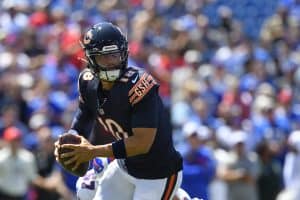
When evaluating a passing offense, you have three personnel groupings to consider. Obviously, you must pay careful attention to the quarterback. A change under center can often move NFL and college football betting lines by a significant margin. Skill-position players, especially wide receivers, matter a lot as well. So do offensive linemen. We’ll focus on the first and third in this column.
You should also pay the most attention to yards gained, not points scored or giveaways. While some quarterbacks and inherently more turnover-prone, they factor into most efficiency metrics at the position, so you’ll be able to dig them up there. Fumbles, especially fumble recoveries, are much more luck-based than skill-based, so fumbles are usually more noise than signal.
Evaluating Quarterback Play | Football Betting & Strategy Guide
Most quarterback stats factor in the play of their teammates. Completion percentage, for example, requires the quarterback’s target to actually catch the ball. Both total yards and yards per pass attempt (Y/PA) have this problem as well. But if you’re looking for the best metrics to evaluate a quarterback individually, dive into completion percentage over expected (CPOE) and expected points added (EPA) per play.
CPOE adjusts for the likelihood of a quarterback’s pass getting completed. A player who attempts many low-percentage throws and completes more of them than average is rewarded; a player who attempts many high-percentage throws and completes an average number of them is not.

Start building your bankroll and securing long-term profits with Portfolio EV. Take advantage of our FREE TRIAL to unlock more +EV bets — visit our Portfolio Betting page to begin your journey!
EPA is a similar metric in that is also based on a quarterback’s contribution above the average. But instead of looking at a quarterback’s accuracy, EPA per play calculates how many more points than the average quarterback the player contributes on a per-play basis. Turnovers, especially pick-sixes, add points to the other team, thus subtracting points from the team (and quarterback) in question. Every full-time starting quarterback (plus Jimmy Garoppolo) with an EPA per play of 0.2 or higher made the playoffs.
Unfortunately, EPA and CPOE are not accessible statistics for those looking to handicap college games. So instead, I recommend that you use passing efficiency. That metric uses a formula that rewards quarterbacks for yards gained, touchdowns thrown and completions while punishing them for interceptions.
Evaluating Offensive Line Play | Football Betting & Strategy Guide
Quarterbacks are usually only as good as their offensive lines. While some guys like Russell Wilson and Lamar Jackson can compensate for poor pass-blocking with their athleticism — and others like Aaron Rodgers can compensate with their quick release — it’s difficult for a good quarterback to look good behind a bad offensive line. I use four easily accessed metrics to evaluate NFL offensive lines and one metric to evaluate college offensive lines.
In the NFL, it’s useful to consider Football Outsiders’ adjusted sack rate, Pro-Football-Reference’s pressure percentage and ESPN’s pass-block win rate to evaluate offensive lines as a group. I then use PFF’s player pages to evaluate individual offensive linemen, especially when one or two members of the group are injured.
Adjusted sack rate is a fairly basic stat that calculates the number of sacks and intentional grounding penalties divided by the number of pass plays. The metric also adjusts for opponent quality and down and distance. However, even Football Outsiders acknowledges that quarterbacks are sometimes responsible for their own sacks and that the metric doesn’t adjust for this.
Pressure percentage is also insightful, but as with adjusted sack rate, it doesn’t fully address quarterbacks who cause their own sacks. Pressure percentage is the times a quarterback is sacked, hurried or hit divided by their total dropbacks minus scrambles. The metric rewards offensive lines that have mobile quarterbacks or who get rid of the ball quickly while punishing those who do not.
Pass block win rate calculates how often an offensive lineman can sustain his block for 2.5 seconds or longer. ESPN tracks both individual and team performance.
College football is harder to evaluate, especially because the NCAA logs sacks as rushing attempts. Havoc rate allowed offers some insight into an offensive line’s play, but it isn’t a perfect metric. Havoc rate is the sum of the total number of tackles for loss, passes defended and forced fumbles divided by total plays; havoc rate allowed is the sum of those plays allowed by an offense divided by the same number.
Evaluating the Offense as a Whole | Football Betting & Strategy Guide
We saved the most important part for last — let’s wrap up by talking about the numbers that I use to holistically evaluate an offense. A few of these metrics are related to the ones that we discussed earlier. For example, EPA per play isn’t just a quarterback statistic — you can calculate it for an entire offense as well. EPA per play is a foundational metric within my NFL betting model.
I also love to use net yards per attempt (NY/A), which, while technically a quarterback stat, offers plenty of insight into the offense as a whole. NY/A takes a quarterback’s net yards, which are passing yards minus yards lost from sacks, and divides it by their total passing attempts. The metric expresses a quarterback’s efficiency, the efficiency of their skill-position players in generating yards after the catch and the pass protection the quarterback is receiving.
In college football, yards per play (Y/P) and yards per pass attempt (Y/PA) are useful substitutes for NY/A. Because sacks are tracked as negative rushing plays, Y/PA necessarily ignores pass blocking, but it still offers some insight into the quality of a quarterback’s receiving corps. Aside from the service academies, whose triple-option offenses make them outliers in the metric, the top four teams in Y/PA all made a New Year’s Six Bowl. Those programs also ranked one through four in overall Y/P.
Index
Part 1. NFL & College Football Betting & Strategy Guide: Offense
Part 2. Expected Points Added (EPA)
Part 3. Net Yards Per Attempt (NY/A)
Part 4. Passing Efficiency
Part 5. NFL & College Football Betting & Strategy Guide: Defense