Few things are more fun than turning your hobbies into cold, hard cash. If you’re an MLB fan, perhaps you’ve considered dabbling in baseball betting — and perhaps you’ve even tried. But are you a profitable MLB bettor? If not, I’m here to break down how to turn a profit on your MLB bets. Regardless of whether the answer is yes or no, the betting experts and Portfolio EV MLB betting tools can help you increase your ROI by finding positive expected value (+EV).
You’ve got a bunch of markets at your fingertips, so we’ve split this article into a series of a few parts, including– how to bet on MLB sides and totals, how to bet on MLB player props and home run betting strategy. If you’re still confused, we have other betting 101 posts for you to check out, and if you’re hungry for more baseball action, check out our MLB betting tools or our MLB betting promos! Anyway, let’s dive into our discussion of how to profit on the MLB.
How to Be a Profitable MLB Bettor: Finding Positive EV

How to Profit on MLB Sides & Totals | Finding Positive EV
If you’re looking for an easy way to profit on MLB sides and totals, you’re not going to find one — they’re an efficient market, and beating them regularly is difficult. However, many stats can help you, especially expected stats, as well as public betting splits, injuries and park factors. A thorough understanding of these concepts will help you make a projection for each game. We’ll tackle each of those topics in this article, but before we do, let’s talk about how you can be a profitable MLB bettor without making projections: Portfolio EV’s market-based approach.
How to Use Portfolio EV to Find Positive EV on the MLB
You can take one of two approaches to devising a sharp betting strategy for all sports, including the MLB. One method involves using a projection-based approach, where you develop your own predictions based on statistics and the current roster to determine the likelihood of a particular bet being successful. Alternatively, you can adopt a market-based approach, where you analyze the odds offered by various sportsbooks to gauge the probability of a bet’s success.
Projection-based models are straightforward and are akin to those utilized by fantasy sports platforms to forecast your team’s performance in a given week. On the other hand, market-based models can be more complex for bettors to grasp. They operate under the assumption that certain odds (and the corresponding wagers placed on them) are more accurate than others. For instance, if a sharp sportsbook like Pinnacle sets a line at -150 and a public book like FanDuel lists the same bet at +150, it’s probably profitable to play it at FanDuel.
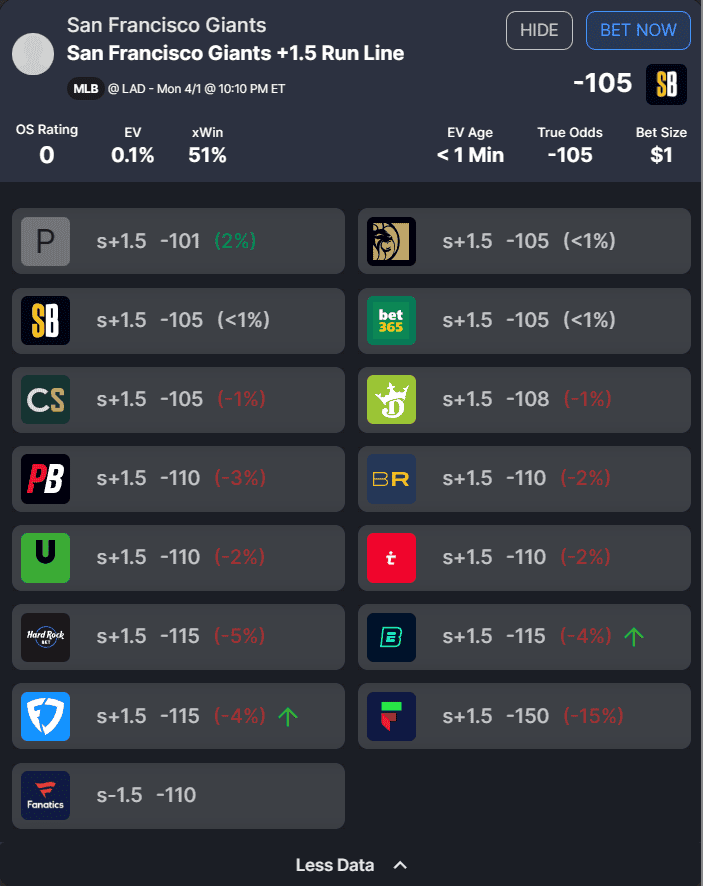
However, discerning which sportsbooks offer sharper odds than others, and determining when your advantage outweighs the hold pocketed by each book, can be challenging. This is where Portfolio EV’s MLB betting model does the hard work for you. Let’s get into an example bet and explore the key terms explained by our product team.
Bet Size: The recommended bet size as a percentage of your bankroll. This metric is based on a fractional Kelly Criterion approach that leads to a reasonable balance of minimizing risk of ruin while maximizing potential reward.
EV: An abbreviation for “expected value,” this metric estimates the long-term profitability of a wager by taking into account the probabilities/payouts associated with each potential outcome.
xWin: The probability of winning the bet implied by the Sharp Sportsbook Algorithm true odds.
OS Rating: The OS rating provides a rating for each +EV bet. An OS rating above 20 signifies an exceptional bet. Ratings between 10 and 20 are highly favorable bets. Finally, a rating between 0 and 10 indicates a solid bet. We factor in the EV, expected win, bet size, and negative geometric drag to calculate this rating.
Hold: The synthetic hold across the entire market, which is the loss a bettor would sustain if he bet both sides of the market to win equal amounts. The larger the hold, the more difficult it is to beat that market. While uncommon, a negative synthetic hold is possible.
True Odds: Odds that represent the real statistical probability of any outcome in a particular sporting event.
How to Use Advanced MLB Statistics | How to Find Positive EV on the MLB
You’ve probably heard all about the traditional baseball stats — batting average, slugging percentage, earned runs average. These help us understand what happened on the field, which can be useful. However, they do not help us understand what arguably should’ve happened over a larger sample.
The tracking stats provided by Statcast help us get there by factoring in contact quality while factoring out defense and other sources of variance. They accomplish this because they are based upon batted balls, not actual on-field outcomes. I lean on them heavily to evaluate teams, batters and pitchers.
While advanced and tracking stats aren’t perfect, metrics like expected weighted on-base average (xwOBA), offer us a squeeze of edge over traditional metrics. For example, in 2022, the Minnesota Twins had the third-worst split between their wOBA (.315) and their xwOBA (.323), which suggests they left some runs on the board. They proceeded to rebound in 2023, recording a much better wOBA (.327) with a minor uptick in their xwOBA (.325).
Another example of this phenomenon is Josh Hader. After starting the 2022 season well, he struggled in the summer, finishing the year with a 5.22 ERA. However, his 3.51 xERA suggests he was better than the results showed. Sure enough, in 2023, Hader recorded an absurd 1.28 ERA while only slightly improving his xwOBA to 2.34. Of course, some examples cut in the other direction, but by paying attention to expected stats, we can generally draw more efficient conclusions and make more efficient bets.
It’s crucial to remember that baseball features a 162-game regular season. Plenty of bets based on sharp analytical reasoning informed by expected stats will lose, in no small part because of variance. It’s possible to be too early when looking for positive regression.
How to Use MLB Park Factors | Profit on the MLB
It’s also crucial to understand where a game is being played. There is no better example of this than last year’s Mexico City Series. Because the city is built at such a high elevation, batters went yard a ton — the first game saw 27 runs scored. The total closed at 15.5 after getting bid up by bettors looking to exploit the neutral site.
We don’t have neutral-site games every day, but park factors can help us understand other ballparks, too. For example, and to state the obvious, Coors Field is a hitter-friendly park, which is largely due to its high elevation. Unsurprisingly, Coors Field ranks as the best park for hitters in Statcast’s park factors model. Likewise, Seattle’s T-Mobile Park is known as a pitcher-friendly park, which is largely due to its low elevation and Seattle’s wet, humid climate.
These numbers have obvious consequences: You’ll often see totals trading in the double digits for games played in Coors Field, but you’ll rarely see that for games played at T-Mobile Park. These trends are important to understand for run-line and moneyline bets as well, as teams trotting out a good pitcher may benefit less than usual. Having a thorough understanding of how a stadium will affect the value of a batted ball is a crucial piece of context to use when analyzing advanced MLB stats.
Another part of park factors: the weather. Humidity and warm temperatures can help the ball travel further. The wind can help, too — if it’s blowing out. If the wind is blowing in, it can hurt. Make sure to check our MLB weather report for today’s conditions!
How to Use MLB Public Betting Splits | Profit on the MLB
Just as how some books post sharper lines than others, some bettors place sharper wagers than others. While you shouldn’t be planning to wager purely based on betting splits, it’s generally helpful to know which side of a side or total the money has been taking action from those sharp bettors — or which side has been drawing public action.
It makes sense to tail sharp bettors and to fade public ones. When the betting splits say that 75% of the bets are on Team A to win side but 75% of the handle is on Team B, you can tell that the public has been buying Team A while sharps have been backing Team B. If you were planning to wager on Team A, it might be worth reconsidering.
Finding accurate information about public betting splits is hard. Pregame has a publicly available dataset that updates automatically, but their sample consists of their own users, not the general betting public. Vegas Insider offers paywalled betting splits from DraftKings Sportsbook. Some books, like BetMGM and bet365, will release betting split information via press releases that sites like ours often publish as well.
How to Use MLB Injury Reports | Profit on the MLB
Finally, it’s important to be diligent about your MLB side and total bets. If you want to be a profitable MLB bettor, you have to know who is playing. Sure, the books will tell you the probable starting pitcher, but that pitcher doesn’t always start the game. The books also won’t tell you about the specific starting lineup.
While not all players will move the line dramatically, some will. For example, if you were excited about backing the Los Angeles Angels as dogs to the Colorado Rockies because of Mike Trout and Shohei Ohtani, it’s more than likely that one (or both) of them were out for that game. If you always check this information before placing your bets, that’s good! Unfortunately, not every bettor does.
But injury reports matter even for players who may not single-handedly move the line. Any changes to the batting order can throw off a team’s rhythm. You can quantify the impact of a given player missing time by taking a stat like their xwOBA and comparing it to their replacement’s to estimate how much of a consequence that injury may have on that game.
