So you’re wondering how to turn a profit on your NHL bets. It’s a good question: beating the sportsbooks regularly can be difficult, especially since you must win over half of your bets to make more than the hold you’re paying. Fortunately, the NHL betting experts and +EV NHL bets available here at OddsShopper can help you increase your ROI by finding positive expected value (+EV) make sure to take Portfolio EV for a spin for free today!
You’ve got a bunch of markets at your fingertips, so we’ve split this article into two parts — this one, which focuses on sides and totals, and another about NHL player props. If you’re still confused, we have other betting 101 posts for you to check out, and if you’re hungry for more baseball action, check out our NHL betting tools or our NHL betting promos! Anyway, let’s dive into our discussion of how to profit on the NHL.
How to be a Profitable NHL Bettor: Finding Positive EV
How to Profit on NHL Sides & Totals | Finding Positive EV
Portfolio EV, our sports betting model, went 8,531-7,813 (6.1% ROI) on all +EV NHL bets with an OS Rating of 2 or higher last season. Click here to get it for free just by signing up with a partner site!
Do you want to increase your NHL betting ROI? If so, there are no easy answers. The NHL betting market operates efficiently, making consistent wins difficult to attain. Nevertheless, several statistical metrics can provide valuable insights, such as expected stats, power-play stats, public betting trends and goaltender news.
A deep knowledge of these numbers can help you make sharp bets for each game by projecting a winner or the total number of goals scored. However, before we get into those projection-based tools, let’s consider a method to profit in NHL betting without them: Portfolio EV’s market-based betting tools, which can help you find positive expected value (+EV).
How to Use Portfolio EV to Find Positive EV on the NHL
Crafting a smart betting strategy for NHL games, or any sport, can follow one of two paths. For the first, you may take a projection-based approach, in which you forecast games based on player and team stats to approximate a wager’s likelihood of success. Alternatively, you can adopt a market-based strategy by analyzing odds from different sportsbooks to arrive at a similar estimate.
Projection-based models resemble those used in fantasy sports platforms, offering straightforward assessments of a team’s expected performance. Market-based models can be more complex, operating on the premise that certain odds are more accurate than others. For instance, if a sharp sportsbook like Pinnacle sets a line at -150 while a public book like FanDuel offers it at +150, you should be jumping all over the line at the public book.
However, identifying which sportsbooks consistently offer sharper odds and determining when the potential advantage outweighs the bookmaker’s edge can be challenging. This is where Portfolio EV (and our +EV betting tools in general) can simplify the process. Let’s examine an example bet and delve into the key concepts as defined by our product team.
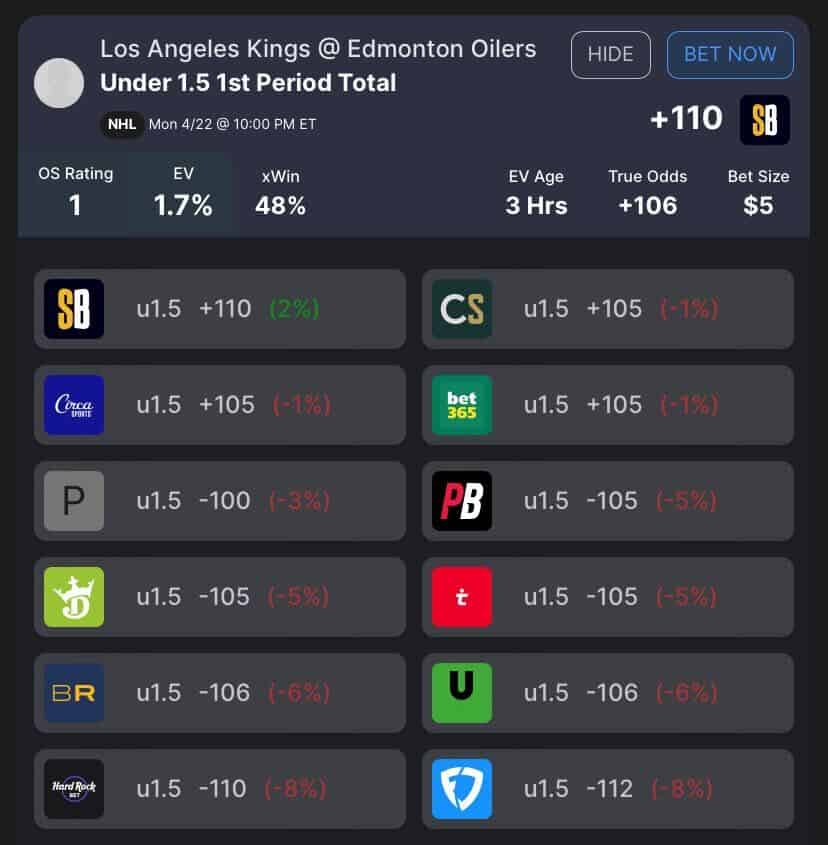

Bet Size: The recommended bet size as a percentage of your bankroll. This metric is based on a fractional Kelly Criterion approach that leads to a reasonable balance of minimizing risk of ruin while maximizing potential reward.
EV: An abbreviation for “expected value,” this metric estimates the long-term profitability of a wager by taking into account the probabilities/payouts associated with each potential outcome.
xWin: The probability of winning the bet implied by the Sharp Sportsbook Algorithm true odds.
OS Rating: The OS rating provides a rating for each +EV bet. An OS rating above 20 signifies an exceptional bet. Ratings between 10 and 20 are highly favorable bets. Finally, a rating between 0 and 10 indicates a solid bet. We factor in the EV, expected win, bet size, and negative geometric drag to calculate this rating.
Hold: The synthetic hold across the entire market, which is the loss a bettor would sustain if he bet both sides of the market to win equal amounts. The larger the hold, the more difficult it is to beat that market. While uncommon, a negative synthetic hold is possible.
True Odds: Odds that represent the real statistical probability of any outcome in a particular sporting event.
How to Use Expected NHL Statistics | How to Find Positive EV on the NHL
You can handicap hockey with several different statistics, but I prefer using expected goals versus actual goals. While actual goals are helpful in understanding what’s happened in the NHL, expected goals are more useful in understanding what should’ve (read: what was likelier to have) happened.
Let’s use the 2022-23 season as an illustration. Although the Boston Bruins were a dominant force, recording an NHL-best goal differential of +127 in all situations, they ranked just sixth in expected goal differential (+43.3). The team that knocked them out in the first round, the Florida Panthers, ranked 16th in actual goal differential (+16) but were a steadier 10th in expected goal differential (+31.5). While Boston’s defeat in the first round of the playoffs caught most off guard, the expected stats reveal that it wasn’t such a shocking outcome.
So how did the NHL’s leaders in expected goal differential fare? The Carolina Panthers led the NHL in the regular season with an expected goal differential of +85.4 and made it to the Eastern Conference Finals, beating the second-ranked New Jersey Devils (+69.5) on the way. In the Western Conference, third-ranked Edmonton (+67.4) made it to the second round, losing to the eventual champions, the 11th-ranked Vegas Golden Knights (+28.2).
In 2022-23, the three teams that benefited the most from non-expected goals — the Boston Bruins (+83.7), New York Rangers (+46.7) and Colorado Avalanche (+33.4) all got bounced in the first round, which suggests their luck ran out and that their strong regular-season performances were assisted by variance.
Understanding expected goals is crucial when handicapping the NHL. While you can count on teams that produce high-quality shots at a high clip, you can’t distinguish those teams from those who benefit from lucky plays just by looking at raw goal data. Perhaps we shouldn’t have seen last year’s collapse from the Bruins as such a surprise.
How to Use NHL Power Play Stats | Profit on the NHL
While understanding the full game is crucial, the power play often decides who wins or loses in the NHL. Fortunately, we can use expected stats to understand power-play and penalty-kill efficiency.
In 2022-23, the Edmonton Oilers led the NHL in power-play goals (82) by 15. They also led the NHL in power-play percentage by 6.4%. However, they led in expected power-play goals (72.5) by only 10, suggesting their advantage wasn’t as big as it may have seemed. Further, those 72.5 expected goals accounted for 23.2% of their total expected goals (311.2).
The Oilers met the Vegas Golden Knights in the second round. Vegas ended the regular season with the NHL lead for the fewest total penalty minutes (589), and, unsurprisingly, they bested Edmonton in six games.
Knowing how much of your team’s offense comes from the power play is essential as some teams commit fewer penalties than others, and you’ll have to adjust accordingly. The same goes for penalty-kill efficiency — if a team commits a ton of penalties but ranks near the top of the NHL in penalty-kill rate, a team that relies on the power play like the 2022-23 Oilers may struggle to put the puck in the net.
How to Use NHL Public Betting Splits | Profit on the NHL
Just as how some books post sharper lines than others, some bettors place sharper wagers than others. While you shouldn’t be planning to wager purely based on betting splits, it’s generally helpful to know which side of a side or total the money has been taking action from those sharp bettors — or which side has been drawing public action.
It makes sense to tail sharp bettors and to fade public ones. When the betting splits say that 75% of the bets are on Team A to win side but 75% of the handle is on Team B, you can tell that the public has been buying Team A while sharps have been backing Team B. If you were planning to wager on Team A, it might be worth reconsidering.
How to Use NHL Projected Goaltender News | Profit on the NHL
The NHL is a bit like the MLB in that the man who starts in the net (like the mound in the MLB) determines much about how the betting market and the public view a game. But unlike the MLB, probable goaltenders aren’t often listed alongside each team, and you won’t be able to find listed goaltender markets.
Because there is often some uncertainty surrounding which goalie a team will start in net, you can get an edge on the books by combing through beat reporters’ Twitters, injury reports and other news sources — as long as you get your action down fast enough.
Just as expected stats help us understand teams, they can also help us to understand goalies. Generally, netminders with loads of goals save above expected (GSAE) are bound to regress. Sure, there are some outlier cases like Connor Hellebuyck, who has ranked as a top-10 goaltender by GSAE, but the exception doesn’t disprove the rule
In 2022-23, Juuse Saros led the NHL in GSAE with 46.7. His Nashville Predators didn’t make the playoffs, so we can’t look there for regression, but the subsequent 2022-23 regular season is illuminating: Saros ranked 69th with -3. The same pattern emerges when looking at the 2021-22 season, albeit less dramatically. Igor Shesterkin led the NHL in GSAE with 34.1 but fell to fifth with 28.1 the next year.
Knowing how well a goaltender performs in GSAE can be helpful for two reasons. First, it can help you identify goalies beating (or trailing) their career numbers in the metric by a wide margin, allowing you to fade (or back) the teams they play for in hopes of scoring some regression. Second, knowing reliable performers in the metric year-over-year can help you identify teams who benefit most from their capable goaltenders, giving you an edge by backing their team if they’re playing — or an edge by fading their team if they’re not.