The Quick Answer
The Cincinnati Bengals playoff chances in 2026 look strange from either direction: this is a team that went 6-11 last season, and the market has hung a 10.5-win total on it anyway. That price, dated July 28, expects a large rebound. Our board lands on the same side. We have Cincinnati winning the AFC North as the AFC's 3 seed, and we hold that call at medium conviction, not more, because the two most honest numbers on this page cut against certainty: teams that missed the playoffs make them the next season just 30.5% of the time, and our own measurement says a win total is a weak predictor exactly in the band where Cincinnati is priced. Below is the full case: why a 6-11 record is the weaker signal here, the division reshuffle this call quietly requires, and the odd fact that the one venue listing this exact market is the one that pays us nothing.
This is the Cincinnati column of our NFL playoff odds hub, which runs one of these pages for every NFL team with the same treatment: the market's real number, a measured base rate, and against-the-spread records computed from the primary 1999-2025 game log, playoff games included. The will stance is an editorial call, not a model output; we have no model for this question and no measured edge against the market on it. What we can do is argue the case in the open, with every counterargument printed, and end at the venue oddity promised above.
Start Where Every Missed-Playoff Team Starts: 30.5%
The right first number is not the win total. It is the base rate, and it cuts against us. Since 1999, teams that missed the NFL playoffs made them the following season 30.5% of the time: 155 of 508, with a 95% confidence interval of 26.7% to 34.6%. That is Cincinnati's anchor, and any column that opens with the market's optimism instead of that three-in-ten figure is selling something.
The base rate for a team in Cincinnati's position is 30.5%, not 50-50. Everything argued below has to earn its way up from that number, not down from the market's enthusiasm.
The reason the door opens at all is churn. An average of 5.96 playoff slots change hands every season, 6.17 since 2020, with a range of four to eight. In a typical year roughly six of the 14 January spots go to teams that watched from home the season before. So the question is rarely whether teams like the Bengals crash the field; several of them do it every season. The question is whether Cincinnati is one of the six, and the market has already answered that question louder than we would have.
The Market Already Made This Argument, And Made It Loudly
As of July 28, 2026, Cincinnati's season win total sits at 10.5. No two-way make-or-miss playoff price was posted in our market file, so we will not manufacture a probability from one side of a market; the win total is the cleanest number the market has published on this team, and it is a striking one. A book does not price a 6-11 team at ten and a half wins by accident. If we simply repeated that number back to you, though, this page would be advocacy wearing a calculator, because we measured what preseason win projections are actually worth, on weeks 1-3 closing spreads from 2002 to 2025, and the answer is: less than they sound. The overall signal is weak, an AUC of 0.733. Here is projected wins against how often those teams made the field:
| Projected Wins | Made playoffs | Sample |
|---|---|---|
| 8 | 35% | 108 teams |
| 9 | 43% | 98 teams |
| 10 | 39% | 110 teams |
| 11 | 62% | 85 teams |
| 12 | 77% | 64 teams |
Cincinnati's price sits exactly between two rows that refuse to agree. The ten-win bucket made the playoffs 39% of the time, lower than the 43% for teams projected for nine. The eleven-win bucket jumps to 62%. A 10.5 straddles the 39% and the 62%, and the wobble underneath, with its overlapping confidence intervals, says the measurement has no real discrimination through the middle of the table. The signal only separates the extremes, and treating a half-win gap in this band as meaningful is exactly what our own file forbids. So the 10.5 cannot settle this question, and the case has to be carried on football reasons instead. Here is where we plant the flag we will come back to: if this call is right, it will be because of what stayed the same in Cincinnati, not what the number says.
Why 6-11 Is The Weaker Signal
The football case starts with continuity. Cincinnati keeps Zac Taylor, and teams that keep their head coach made the playoffs 42.6% of the time in our log, 271 of 636, the highest of the three coaching situations we measured. Part of that gap is selection, since good teams have no coach to fire, so do not read the 42.6% as a Cincinnati forecast. The controlled test is the more telling one: continuity teams landed essentially dead on their market-implied win totals. The market is very good at pricing teams that kept their coach, and this team that kept its coach is priced at 10.5. For the record, the coaching-change side of that measurement is null in both directions, first-time head coaches beat their implied total by 0.19 wins and retreads missed by 0.29, neither statistically significant, so nothing in this cluster treats a coaching situation as an edge. Continuity is not a bonus; it just means the 10.5 was priced with clear eyes.
Then there are the two men the price is really about, and here we print records, samples and caveats together, because an against-the-spread record describes history and forecasts nothing. Taylor's teams are 67-53-3 against the spread, a 55.8% cover rate over 123 games with a 95% confidence interval of 46.9% to 64.4%, the best mark among the coaches on our will list with a meaningful sample. The splits have texture: 38-24-0 on the road (61.3% over 62 games), 5-2-0 in the playoffs (7 games, far too few to mean anything), and a plain 25-24-2 across the last three seasons (51.0% over 51 games), which is the split that keeps our conviction at medium. Joe Burrow's teams are 51-31-2 against the spread, 62.2% over 84 games, confidence interval 51.4% to 71.9%, including a 30-14-0 road mark (68.2% over 44 games). A quarterback's ATS record conflates the player with every roster around him, so treat that as description, not evidence about Burrow himself. One honest flag on all of these figures: our records include playoff games, which most published ATS tables do not, so our counts run higher than what you may see elsewhere.
The number I keep coming back to is not any of those covers. It is the near-zero miss.
On average, a team that kept its head coach finished 0.01 wins under what the market implied. The market is at its sharpest on continuity teams, and this continuity team is priced at 10.5.
The disagreement between a 6-11 record and a 10.5-win price is the market saying last season's record was the outlier in this team's history, not the baseline. Our board agrees. But agreeing with the market on the team is not the same as handing them the division, and that second step is where this call gets expensive.
The Reshuffle This Call Quietly Requires
Cincinnati's playoff slot has to come out of somebody's hands, and on our board it comes out of Baltimore's and Pittsburgh's. That should be said plainly. Our Baltimore Ravens column argues the won't side against the division's best win total, an 11.5. Our Pittsburgh Steelers column argues that Pittsburgh, 10-7 and a playoff team last season, misses this time. We then send two AFC North teams anyway, Cincinnati as the 3 seed and division winner, and Cleveland as a wild card. Taken together, the board is not just backing the Bengals; it is calling a full reshuffle of the division, dropping its best number and its incumbent playoff team.
The board is calling a full AFC North reshuffle: it drops the division's best win total and its incumbent 10-7 playoff team to send Cincinnati and Cleveland instead. That is the boldest claim on this page, and it deserves its counterargument in print.
The counterargument writes itself, and we will write it: nothing in Cincinnati's own divisional history supports swagger here. Taylor's teams are 19-23-1 against the spread in AFC North games, a 45.2% cover rate over 43 games, and Burrow's are 13-15-1 (46.4% over 29 games), the worst splits on this page. The same measurement that showed the win-total table flat through the middle applies here too; a 43-game divisional sample carries a confidence interval from 31% to 60%, wide enough to hold almost any truth. But if you are looking for the soft spot in this column, this is it: the case asks a team with a below-water divisional history to take the division from an 11.5-win favorite. That is why the conviction reads medium, and why the prose on this page hedges where other previews would pound the table.
Worked Example: What Ten And A Half Wins Actually Buys
Now put the market's number against what qualification costs, because this is where the 10.5 goes from an opinion about the roster to a claim about January. In the 17-game era, here is how often each win count has made the field:
| Season Wins | Made playoffs | Sample |
|---|---|---|
| 8 | 11% | 18 teams |
| 9 | 39% | 23 teams |
| 10 | 94% | 16 teams |
| 11 | 100% | 12 teams |
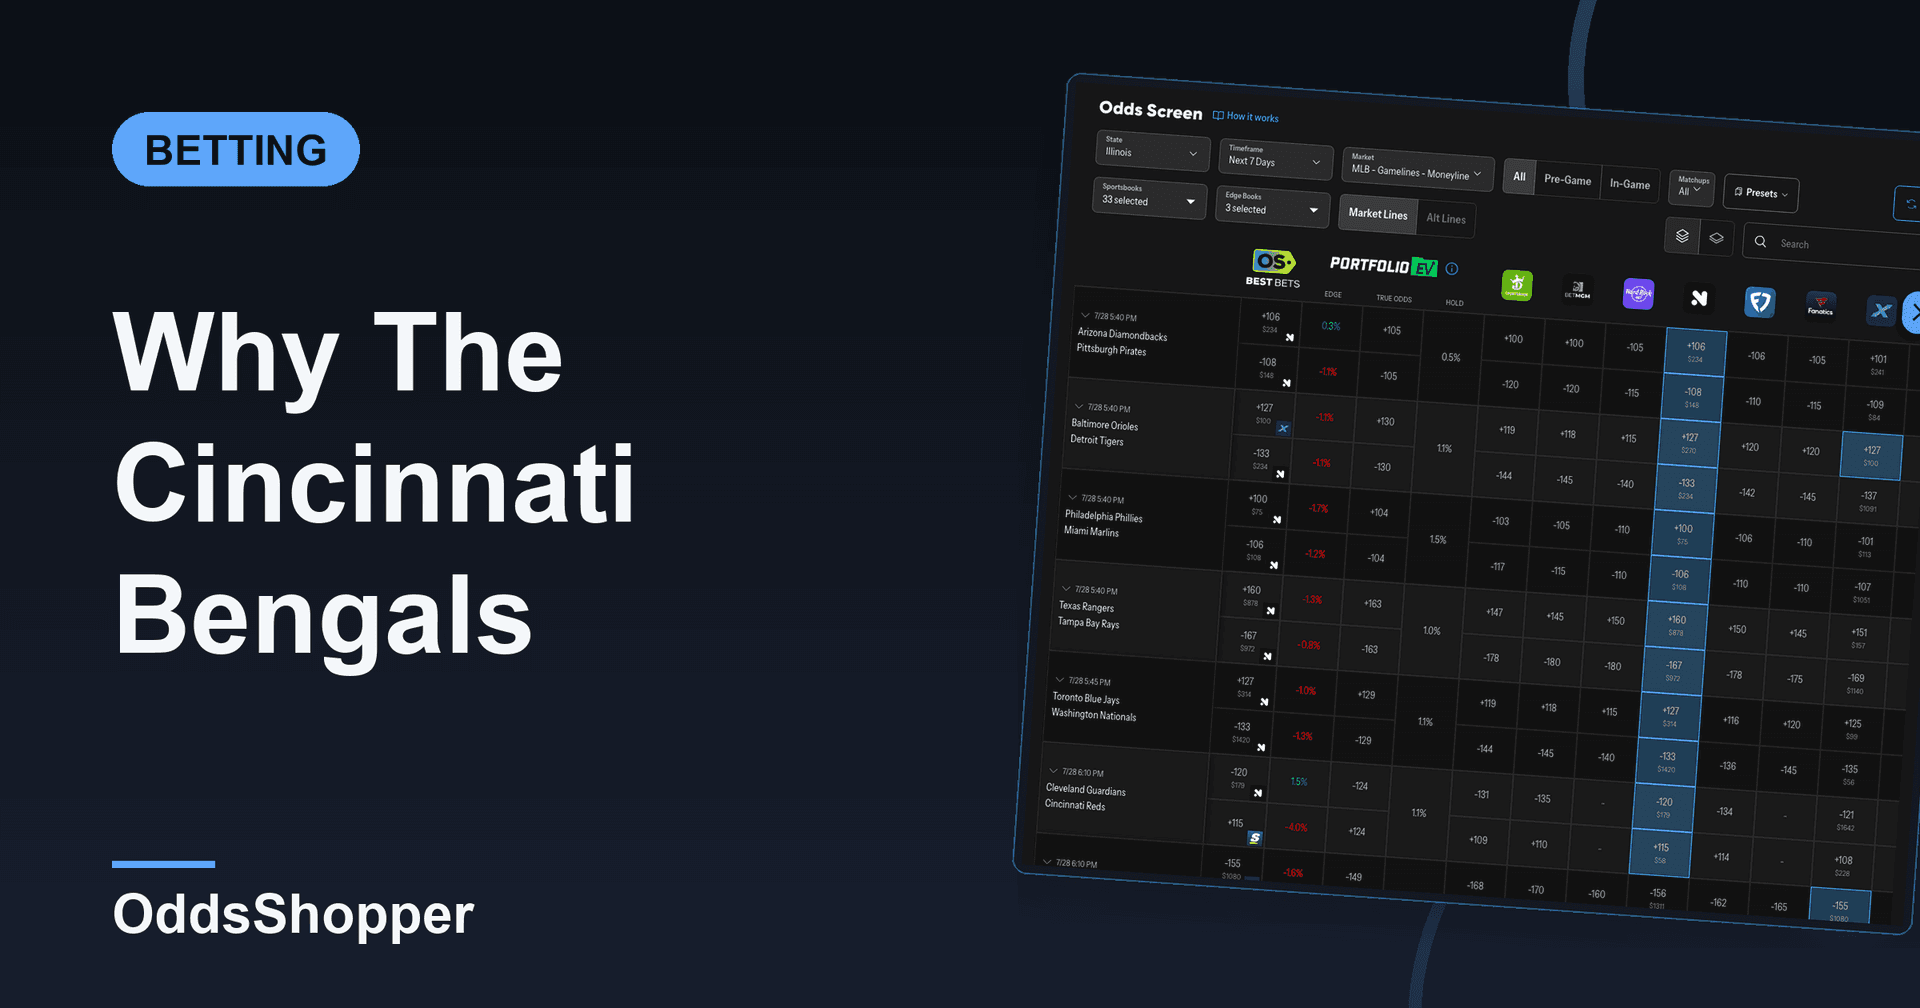
The whole season lives in one step of that table: nine wins has made the playoffs 39% of the time, ten wins 94%. The market's 10.5 sits a full win above that cliff, and the cushion is the real information in the price. Even the under side of this total, a ten-win season, has made the field 94% of the time; the season only turns dangerous at nine, where the 39% takes over. And here the callback from the projection table lands with teeth: 39% is also what the ten-win projection bucket delivered, a reminder that a preseason projection of ten wins and an actual ten-win season are very different objects. Either way the market will grade this page week by week once September lines post, and the live NFL odds screen is where we will watch it happen; it surfaces the best available number on every Bengals game line across DraftKings, FanDuel, BetMGM, Caesars and the rest of the board, and our guide to real-time NFL odds covers how to shop those numbers properly. If you want plays that settle faster than a January question, our free expert picks run every day.
Where To Trade It, And Who Pays US
Here is the oddity promised at the top. Kalshi lists a market on this exact question: KXNFLPLAYOFF-27-CIN, "Will Cincinnati be one of the 2026-27 Pro Football playoff qualifiers?", closing January 25, 2027. It is the only venue carrying a per-team NFL playoff market, and it is trading live: as of August 18, 2026, YES on a Bengals playoff berth is bid at 62 cents and offered at 66, with roughly 5,900 contracts traded so far. Read the midpoint, about 64 cents, as the market's working answer, not a verdict; we will not dress it up as a fair probability, because our market file has no honest two-way de-vig to check it against. This is not a recommendation to take either side of that book. It is the direct market on everything this page argues, and it is the number this column will be graded against. When this page first ran in late July, that order book was empty; now that real volume is in it, the Liquidity Tool is how we track where exchange and prediction-market money is landing on questions like this one.
KXNFLPLAYOFF-27-CIN is trading live: YES bid 62 cents, offered at 66, as of August 18, 2026. We are not inviting you to take either side; it is the direct market on the question this page argues.
Full transparency on the incentives, because it is the most credible thing this page can offer: Kalshi pays us nothing. We have no affiliate or commercial relationship with them, and they still get the primary mention because they carry the market. Two more disclosures belong right here, not in a footer: Stokastic trades prediction markets and holds positions in them, and nothing on this page is trading advice; the stance is an argued editorial case, not a recommendation to take a position. Polymarket, which does pay us a commission on sign-ups, does not carry a per-team playoff market at all. What Polymarket US offers is championship futures, a different bet entirely: its NFL Champion 2027 market has traded about $42 million across 33 outcomes, and it lists conference futures too, such as the 2027 NFC Champion market at about $6.3 million. A playoff berth and a championship are different questions, so do not treat one market as a substitute for the other. If prediction markets are new territory, our explainer on how prediction markets work covers the mechanics.
If you do want to trade championship futures on the Polymarket US App, code OS4 gets new users the current sign-up offer: Deposit $10, get a $50 trading bonus. We are a Polymarket partner and may earn a commission if you sign up through our link; full details live on our Polymarket promo code page.
Claim the Polymarket US App offer with code OS4
18+ Only. Restrictions and eligibility requirements apply. Not available in all jurisdictions. Trading is risky. 100% loss can occur. See polymarket.com/tos for more information. The Polymarket US App serves as an independent software provider and affiliate of Polymarket US and Polymarket Clearing, the CFTC-regulated exchange and clearing organization. Event contracts are CFTC-regulated derivatives, not sportsbook wagers, and a position can lose its full value.
More on this: Washington Commanders Playoff Chances: Just 30.5% · Los Angeles Rams Playoff Chances: Why They Get In · Atlanta Falcons Playoff Chances: 30.5% Says Miss · Why The Green Bay Packers Will Make The Playoffs · Philadelphia Eagles Playoff Chances 2026
The Season Will Answer, And This Page Will Keep Score
Zoom back out to the two numbers this column keeps circling: 30.5% and 10.5. The base rate says a team coming off a missed postseason has about a three-in-ten shot at the field; the market says this particular team is a large rebound waiting to happen; and our own measurement says the market's number, on its own, is a weak predictor exactly in the band where Cincinnati is priced. So the call rests where we said it would: on continuity the market prices almost perfectly, on a coach and quarterback whose teams have covered at 55.8% over 123 games and 62.2% over 84, samples attached, and on a division reshuffle we argue openly rather than assume. The season will grade the call in a specific order: first the September spreads tell us whether the market still believes its own 10.5, then the AFC North games, where Cincinnati's 19-23-1 divisional cover history lives, tell us whether the reshuffle is real. Medium conviction, stated reasons, every counterargument in print. If the Bengals make us wrong, that will be printed here too. The record is the point.