The Quick Answer
The Washington Commanders playoff chances in 2026 rest on the most ordinary ledger in this series: Washington went 5-12 and missed the NFL playoffs in 2025, kept Dan Quinn on the sideline, and carries a 7.5-win market total as of July 28, a number one notch below the band where a July projection stops telling you anything at all. The measured base rate for a team that missed is a 30.5% return, and our NFL bracket hands the NFC East's spots to Philadelphia and Dallas, which leaves Washington out. No conviction is recorded on this stance, so the case is laid out here, not pounded. Below: the base-rate math, the continuity finding that actually cuts against this column, Dan Quinn's real against-the-spread record with its 127-game sample printed beside it, the Dallas comparison this page owes you, and the one venue where this exact question is listed to trade.
This is the Washington column of our NFL playoff odds hub, which runs one of these for all 32 teams with the same treatment: the market's real number, a measured base rate, and against-the-spread records computed from the primary 1999-2025 game log. The stance is an editorial call; we have no model for this question and no measured edge on it, so what follows is an argued case with its weaknesses in plain view. And the thesis here is unusual for a takes column, because it is a thesis about ordinariness: a 5-12 team keeping its head coach, priced in the lower-middle of the league, with nothing measured about it that is extreme in either direction. The value of this page is being precise about how unremarkable the case is, rather than manufacturing drama the numbers do not carry. The complication arrives on schedule: the strongest single number on this page, the 42.6% base rate for coaching continuity, argues for Washington, not against it. That tension gets its own section, and the page ends on the only market built to settle the question, and what its live price says now.
A 5-12 Season Starts The Climb At 30.5%
Since 1999, teams that missed the NFL playoffs made them the following season 30.5% of the time: 155 of 508, with a 95% confidence interval of 26.7% to 34.6%. That is Washington's anchor, the harder of the two starting points; a team that made the field returns at 52.5%. The openings are real, an average of 5.96 playoff slots turn over per season, 6.17 since 2020, with a range of four to eight, so roughly six of 14 January spots change hands every year. But the arithmetic is unsentimental about who claims them: about seven in ten teams that miss the playoffs miss again, and a 5-12 finish left Washington deeper in that pool than most.
The anchor is a league-wide average, though, and it contains everything from loaded rosters that underachieved to outright teardowns. Sorting one from the other is the market's job, and its number for Washington is where the argument gets specific.
The Market Says 7.5, One Notch Below The Flat Middle
As of July 28, 2026, Washington's season win total sits at 7.5. No two-way playoff price was posted in our market file, so we will not manufacture a de-vigged make-or-miss probability from one side of a market; the win total is the cleanest number the market has published on this team. We measured what a preseason win projection can actually tell you, on weeks 1-3 closing spreads from 2002 to 2025, and the signal is real but weak, an AUC of 0.733. Here is projected wins against how often those teams actually made the field:
| Projected Wins | Made playoffs | Sample |
|---|---|---|
| 5 | 17% | 60 teams |
| 6 | 18% | 77 teams |
| 7 | 28% | 98 teams |
| 8 | 35% | 108 teams |
| 9 | 43% | 98 teams |
| 10 | 39% | 110 teams |
| 11 | 62% | 85 teams |
| 12 | 77% | 64 teams |
The row that matters here is seven: teams projected around seven wins made the playoffs 28% of the time, on 98 of them, almost exactly the 30.5% anchor Washington already carries. That is worth pausing on, because it means the market's number adds close to nothing beyond what the missed-last-year base rate already said. And the table's broader honesty matters just as much: it goes flat through the middle, with 8, 9 and 10 projected wins making the field 35%, 43% and 39% of the time, non-monotonic, with overlapping confidence intervals. A 7.5 total sits between a 28% band and a 35% band, and nothing in this measurement licenses treating that half-win as decisive. So this column will not lean on the number as though it settles anything; the measurement behind this page is explicit that it does not. What the 7.5 does establish is the height of the wall in the worked example below. Before that, the finding that makes this particular column harder to write than most.
Washington Kept Its Coach, And That Is The Best Base Rate On This Page
Dan Quinn returns for 2026, and here is the counterpoint this column is obligated to print before it argues anything else: coaching continuity is the highest base rate of the three coaching situations we measured. Teams keeping their head coach made the playoffs 42.6% of the time, 271 of 636, against 25.6% for first-time hires and 32.8% for retreads. Continuity teams also landed, on average, within 0.01 wins of their market total. Washington has continuity, and continuity is the good column. That cuts against the stance, and it belongs in the second sentence of this section, not the last.
What the measurement does not do is turn continuity into an edge, in either direction. The raw playoff-rate gaps between coaching situations are selection, not causation; teams that fire coaches are bad teams already. The controlled test is wins against market-implied wins, and it is null everywhere: first-time hires beat their number by 0.19 wins (t=1.17), retreads missed by 0.29 (t=-1.30), neither significant, and continuity teams tracked their number almost exactly. The market prices coaching situations correctly. So the fair reading for Washington is narrow: keeping Quinn removes a drag that never measurably existed, and the 42.6% figure describes the whole population of stable teams, most of which were stable because they were already good. A 5-12 team that keeps its coach is still a 5-12 team priced at 7.5 wins; it simply is not carrying any additional, measurable coaching penalty on top.
Quinn And Daniels Against The Spread, With The Samples Attached
Our log has Dan Quinn's teams at 59-68-0 against the spread, a 46.5% cover rate over 127 games, with a 95% confidence interval of 38.0% to 55.1%. Below even money on a reasonable sample, and the splits fill in the shape: 28-36-0 on the road (43.8% on 64 games), 29-40-0 as a favorite (42.0% on 69), against a better 30-28-0 as an underdog (51.7% on 58) and 19-18-0 across the last three seasons (51.4% on 37). Our records include playoff games, which most published ATS tables do not, and his playoff line is his best: 5-3-0, 62.5%, on eight games.
Now the reading that record does not support, stated plainly because the data behind this page insists on it. Quinn's 46.5% measures market pricing, not coaching quality. A cover rate below 50% means the market has, historically, expected slightly more from his teams than they delivered against the number; it is not evidence about this roster, and this page does not present it as proof of anything about 2026. The confidence interval runs from 38.0% to 55.1%, which contains even money, and the whole figure is context for how the market has graded his teams, nothing more.
A career ATS record describes history and forecasts nothing; the measured effect of a coaching situation on wins versus the market is null. Quinn's 46.5% on 127 games is context and color, never a reason to expect Washington to miss a cover.
Jayden Daniels' log is shorter and it says less than it appears to. His teams are 12-11-0 against the spread, 52.2% over 23 games, with a confidence interval of 33.0% to 70.8%, an interval so wide it contains both a bad team and a great one. The splits are louder and even less trustworthy: 7-2-0 at home (77.8%, on nine games), 5-9-0 on the road (35.7%, on 14). Nine games is noise wearing a fact's clothing, and this series quotes the sample every time for exactly that reason. The one line worth keeping is that Daniels has already played playoff football, and his teams covered in two of three playoff games. A quarterback's ATS record conflates the player with his team, so none of this is a property of Daniels himself; what it establishes is only that the quarterback is not the reason this column argues a miss. The reason lives one level up, in the bracket.
The NFC East Call, And The Dallas Comparison This Page Owes You
Our board sends two NFC East teams to the playoffs, Philadelphia and Dallas, with New York and Washington staying home. Washington's absence is a consequence of that call, not a separate finding, and this section exists to say so rather than dress the bracket up as an extra piece of evidence against the Commanders.
The comparison worth sitting with is Dallas, because Dallas also missed the playoffs last season. Two teams from the same division, both on the 30.5% anchor, and our board splits them. A reader is entitled to ask why, and the honest answer is that a full-league board forces choices a single-team column never has to make: seven NFC spots, every division sending a winner, and our board judged Dallas's case for a turnaround stronger than Washington's climb from 5-12. That is a judgment call, argued in full on the Dallas page, and a different honest board could swap those two teams without being wrong in July. What the bracket does make concrete is the shape of Washington's path: it is not enough to be better; the Commanders would need to outrun at least one of the two division rivals our board preferred, or take a wild-card spot from the rest of the conference at 7.5 projected wins.
Two NFC East teams missed the playoffs in 2025. Our board brings one back and leaves the other out. The difference is a bracket judgment, printed here as one, and the season will grade it.
Worked Example: From 7.5 To The Win Cliff
The win total and the playoff question connect through one table. In the 17-game era, here is how often each win count has made the field:
| Season Wins | Made playoffs | Sample |
|---|---|---|
| 6 | 0% | 8 teams |
| 7 | 0% | 17 teams |
| 8 | 11% | 18 teams |
| 9 | 39% | 23 teams |
| 10 | 94% | 16 teams |
| 11 | 100% | 12 teams |
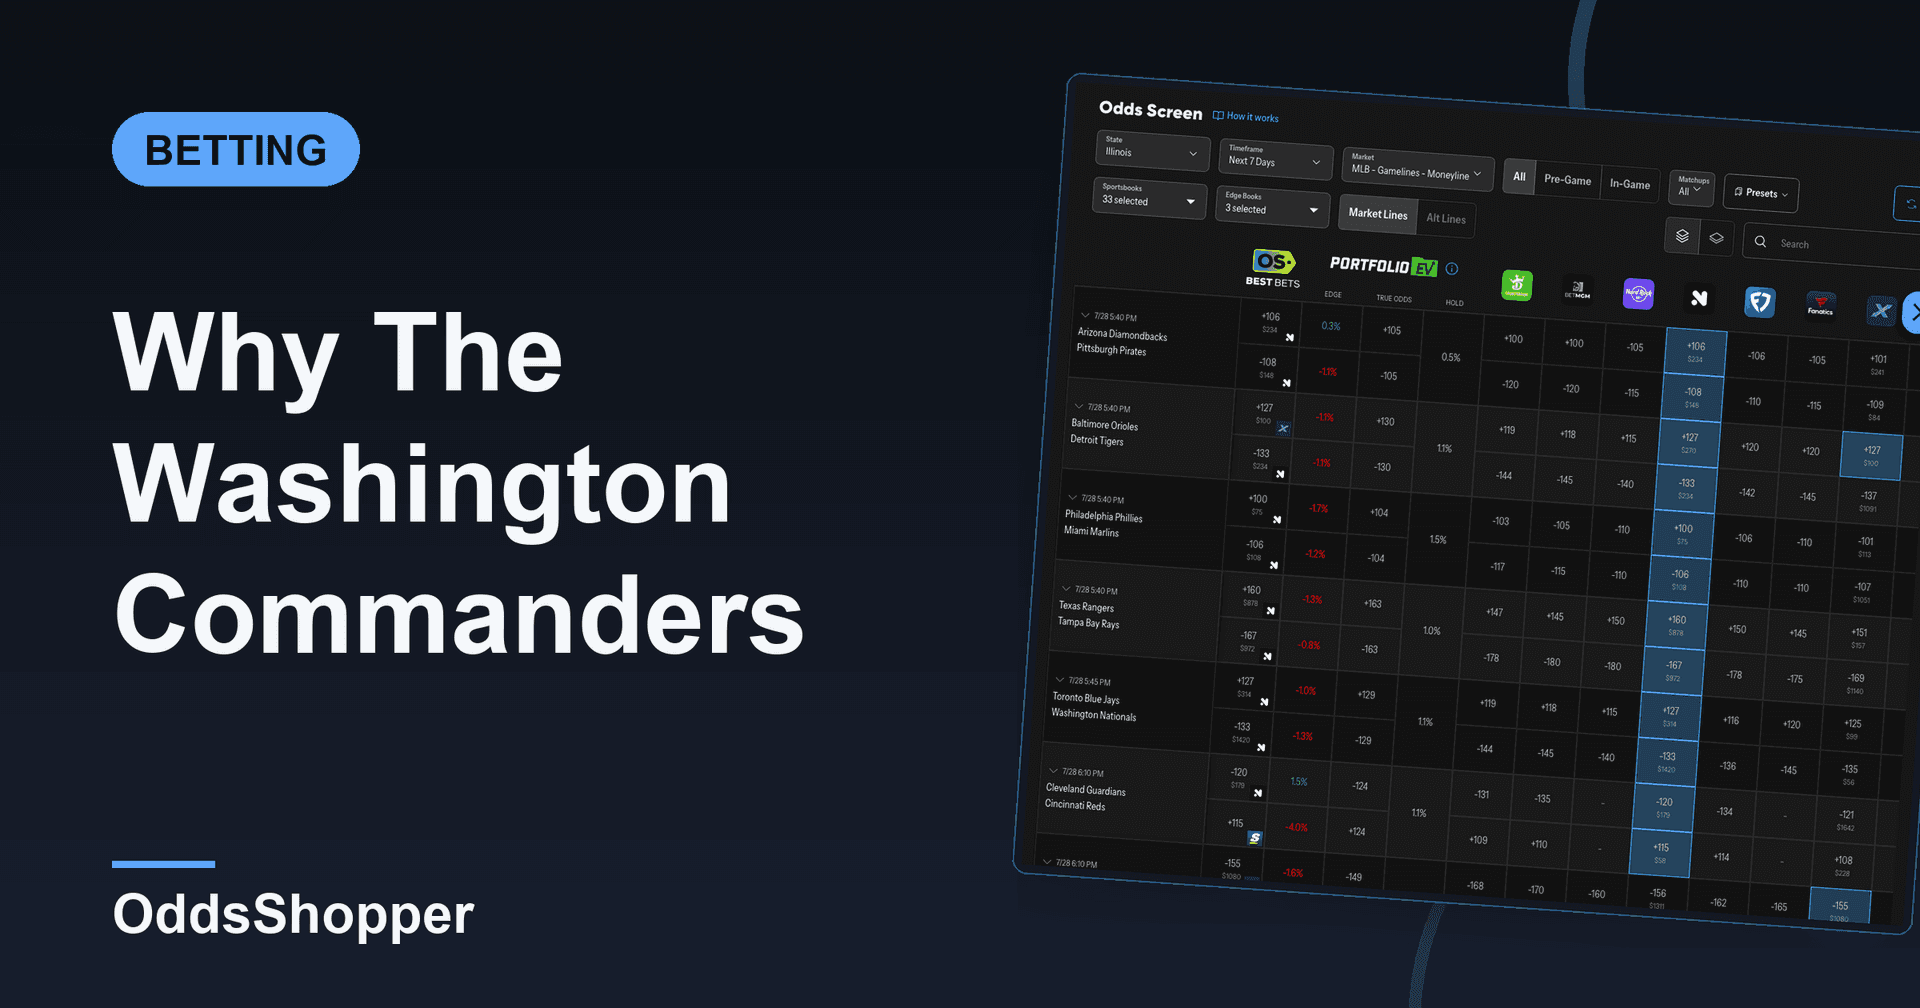
The season turns on one row: nine wins has made the playoffs 39% of the time, ten wins 94%. Now run the worked math from Washington's own number. A team priced at 7.5 that lands just under its total finishes 7-10, and seven wins is 0 for 17 in the 17-game era; land just over at eight and the rate is 11%, two teams in 18. One note on reading the two tables together: the earlier one grades July projections, this one counts the wins a season actually banks, which is why 7.5 maps to a 28%-to-35% band there and to near-zero rows here. To reach the nine-win row, the 39% row where tiebreakers decide, Washington must beat its market total by a win and a half; to reach the ten-win row, where a berth has been close to automatic, by two and a half. That is the whole case in one sentence, and it is deliberately undramatic: Washington is far from hopeless, and the market has still priced a team that needs to clear its number by a wide margin, in a division where our board already filled both seats. When September lines post, the live NFL odds screen is where to watch the market grade that question week by week; the tool surfaces the best available number on every Commanders game line across the major books, and our guide to real-time NFL odds covers how to shop those numbers properly.
The Honest Case Against This Column
A column that argues only one side is advocacy, so here is the other side in full. Continuity is the highest coaching base rate we measured, 42.6%, and Washington has it while half the league churns sidelines. The 7.5-win total is one July consensus reading of a weak signal, AUC 0.733, and the 28% band it borders still means more than one in four such teams broke through. Quinn's 46.5% spread record is a fact about market expectations, and this page has said so twice. Daniels' sample is 23 games and his interval spans 33% to 70.8%, which is another way of saying the data has not decided who he is against the number. And the bracket argument is circular by construction: Washington misses on our board partly because our board chose Dallas, a team that also missed last season, and that choice is a judgment the season is fully capable of reversing. No conviction is recorded on this stance; that absence is deliberate, and the register of this page reflects it.
What would make the call right is checkable: Washington lands within a win or so of its 7.5 number while Philadelphia and Dallas take the East's seats, the ordinary resolution for a team priced where it is. What would make it wrong is just as plain: the second-year leap arrives, nine or ten wins show up, and the team our board left out takes a seat from one of the teams it kept. The season will pick one, and this page prints the result either way. If you want action before any of this settles, our free expert picks run every day.
Where To Trade It, And Who Pays US
Here is the fact promised at the top. Kalshi lists a market on this exact question: KXNFLPLAYOFF-27-WAS, "Will Washington be one of the 2026-27 Pro Football playoff qualifiers?", closing January 25, 2027. It is the only venue carrying a per-team NFL playoff market, and it is trading live: as of August 18, 2026, YES on a Commanders playoff berth is bid at 25 cents and offered at 28, with roughly 12,600 contracts traded so far. Read the midpoint, about 26.5 cents, as the market's working answer, not a verdict; we will not dress it up as a fair probability, because our market file has no honest two-way de-vig to check it against. This is not a recommendation to take either side of that book. It is the direct market on everything this page argues, and it is the number this column will be graded against. When this page first ran in late July, that order book was empty; now that real volume is in it, the Liquidity Tool is how we track where exchange and prediction-market money is landing on questions like this one.
Full transparency on the incentives, because it is the most credible thing this page can offer: Kalshi does not pay us anything. We have no affiliate or commercial relationship with them, and they still get the primary mention because they carry the market. Polymarket, which does pay us a commission on sign-ups, does not carry a per-team playoff market at all. What Polymarket US offers is championship futures, a different bet entirely: its NFL Champion 2027 market has traded about $42 million across 33 outcomes, and its 2027 NFC Champion market about $6 million more, where Washington was priced at 3.35 cents as of July 29. A playoff berth and a conference championship are different questions, so do not treat one as a substitute for the other. If prediction markets are new territory, our explainer on how prediction markets work covers the mechanics.
If you do want to trade championship futures on the Polymarket US App, code OS4 gets new users the current sign-up offer: Deposit $10, get a $50 trading bonus. We are a Polymarket partner and may earn a commission if you sign up through our link.
Claim the Polymarket US App offer with code OS4
18+ Only. Restrictions and eligibility requirements apply. Not available in all jurisdictions. Trading is risky. 100% loss can occur. See polymarket.com/tos for more information. The Polymarket US App serves as an independent software provider and affiliate of Polymarket US and Polymarket Clearing, the CFTC-regulated exchange and clearing organization. Event contracts are CFTC-regulated derivatives, not sportsbook wagers, and a position can lose its full value.
More on this: Bengals Playoff Chances: 3-Seed Call at 10.5 Wins · Los Angeles Rams Playoff Chances: Why They Get In · Atlanta Falcons Playoff Chances: 30.5% Says Miss · Why The Green Bay Packers Will Make The Playoffs · Philadelphia Eagles Playoff Chances 2026
The Record Stays On The Page
Zoom back out to the two numbers this column keeps returning to: 30.5% and a win and a half. A team that missed the playoffs returns about three times in ten, and Washington's own market number says it must beat its total by a win and a half just to reach the row where nine wins have qualified 39% of the time. This page argues the Commanders do not clear that wall, that the East's seats go to Philadelphia and Dallas, and it argues in neutral register, with the strongest counterargument, that Washington holds the best coaching base rate on the page, printed alongside rather than buried. The first honest test arrives early: if September's game lines start pricing Washington like a nine-win team rather than a 7.5-win one, the cliff math above says the call is already under pressure, and this page will say so. It is a permanent page, rebuilt as the season answers the question, and if the Commanders make us wrong, that will be printed here too. The record is the point.