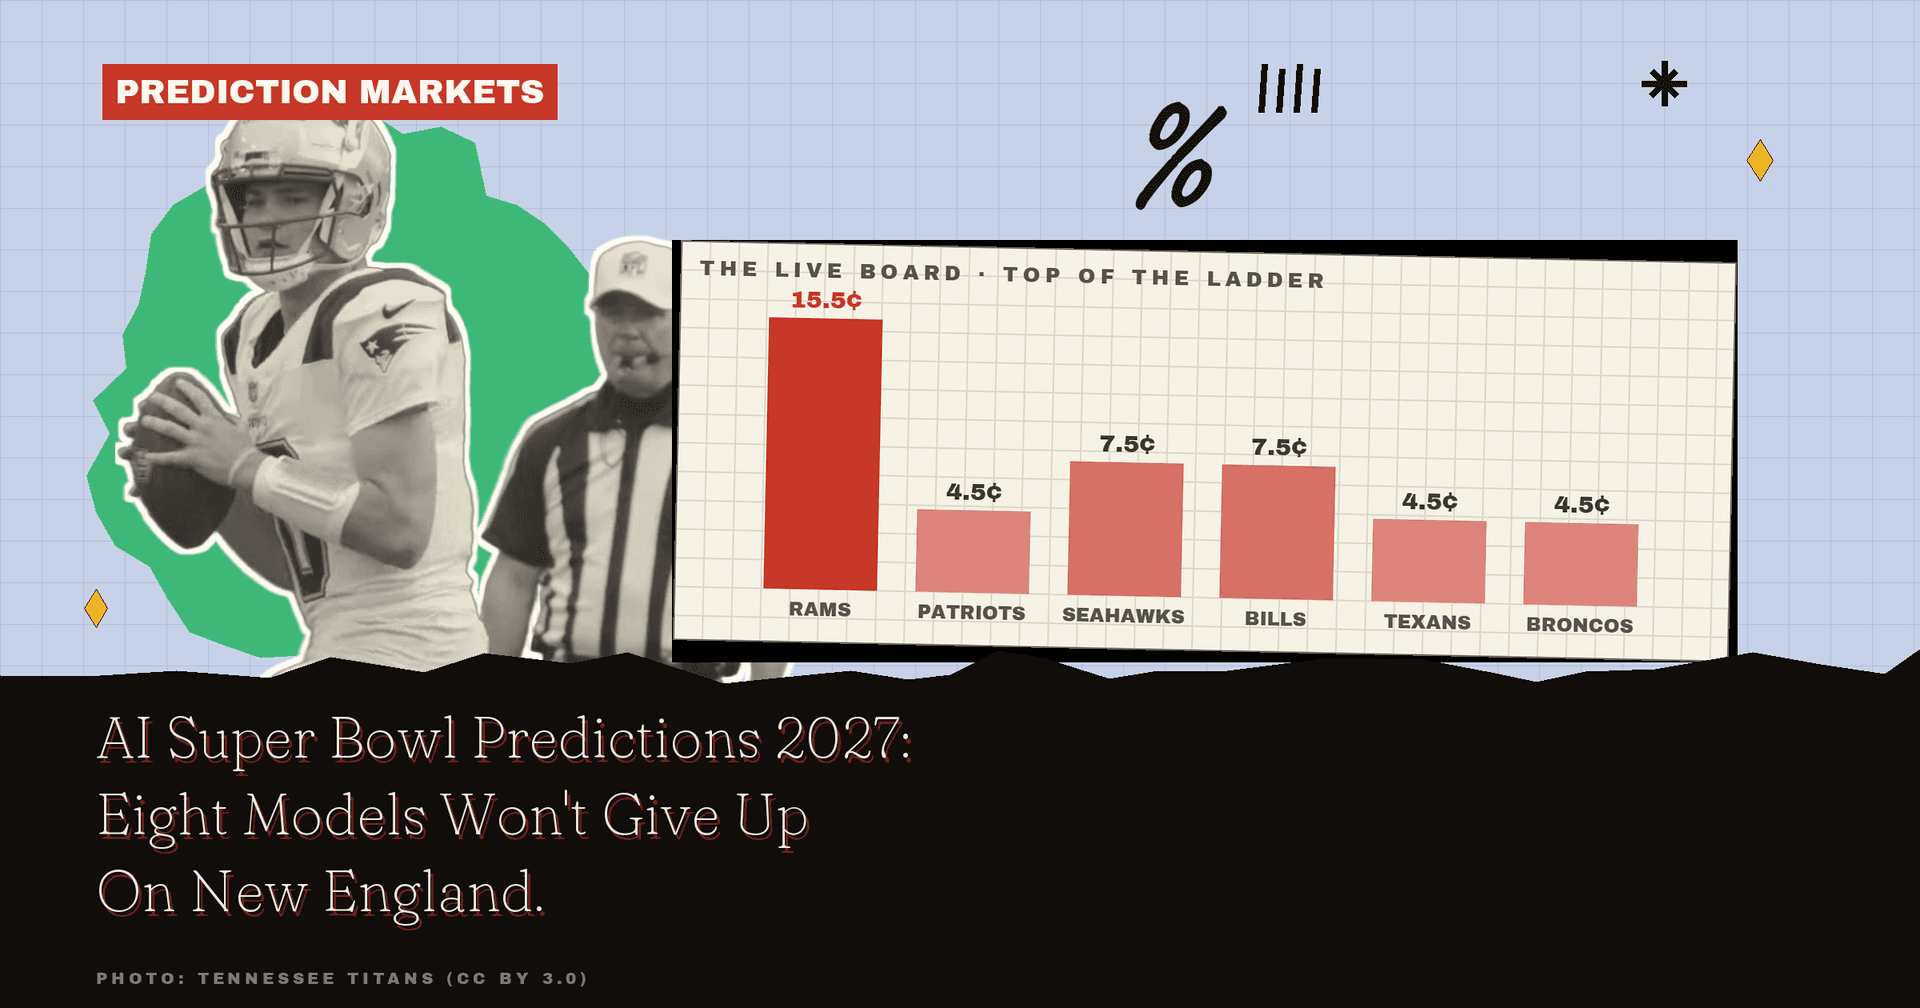
Six months ago New England came within 16 points of a title, and the money has already stopped paying for it. Kalshi splits the championship of the 2026 NFL season into 32 separate yes/no contracts, one per team, and the Patriots sit at four and a half cents, the exact price the board also puts on 6-11 Cincinnati and 7-9-1 Dallas. We asked eight AI models to price the same 32 teams without letting any of them see a single price, working from the 2025 season, the current rosters and 20 years of champion history. Not one of them priced New England below 11 percent. Their middle number is 11.4 percent, roughly two and a half times what the board is charging - a disagreement we publish as a graded public record, not a recommendation: historically the market wins about two-thirds of gaps this wide.
The models did not fight the market's favorite. All eight put the Los Angeles Rams first, which is where the money has them too. The argument is about who stands behind the Rams. Both sides keep Seattle and Buffalo in the second tier, and after that the two boards stop agreeing almost entirely.
New to Kalshi event markets? Start here with how Kalshi's yes/no NFL contracts actually work.
The Quick Answer
Kalshi's market makes the Los Angeles Rams the clear favorite at 15.5 cents, with Buffalo and defending champion Seattle level at 7.5, Baltimore at 6.5 and Kansas City at 5.5. Our price-blind AI models agree on the Rams and then diverge sharply on the rest of the field.
Pricing an NFL combo on Kalshi?The free Kalshi Combo Simulator on Stokastic.com plays this week's game 10,000 times and prices any combo next to the Kalshi price.
- Market Favorite: Los Angeles Rams, 15.5 cents, about 14.8 percent once the whole board is rescaled to add to 100
- Model Favorite: Los Angeles Rams as well, at a 12.5 percent middle reading across the eight models
- Biggest Model Overweight: New England Patriots, 11.4 percent against a price worth roughly 4.3 percent, the widest gap on the board by a distance
- Biggest Model Fade: Dallas Cowboys, 1.0 percent against a price worth about 4.3 percent, off a 7-9-1 season and a minus-40 point differential
- The One-Line Read: the market is paying for brand-name rosters that lost in 2025, and the models are paying for the teams that were actually good.
The full 32-team board, every model's individual number, the two models that changed their pick after reading the others, and a plain-English guide to reading these prices are all below.
Stay ahead of the markets.
Daily insights and expert picks on Kalshi, Polymarket, and what's moving markets.
Free forever. Unsubscribe anytime.
The Market At A Glance
| Venue | Kalshi, a CFTC-regulated event-contract exchange, 18+, availability varies by state, as of August 2026 |
| The Event | "2027 Pro Football Champion" (Kalshi event KXSB-27), 32 separate yes/no team contracts |
| The Contract | Each market resolves YES only if that team wins the championship of the 2026 NFL season |
| Settles | Expected on or around February 14, 2027, once the game is played |
| Prices Below As Of | August 22, 2026, taken from the midpoint of each contract's live bid and ask |
How The Price-Blind Panel Works
The models never saw any of these prices. They were handed a fetched summary of the 2025 final NFL standings and postseason bracket, every team's head coach and quarterback room as the rosters read today, all nine 2025 league awards and the top ten in every 2025 statistical category cross-checked against where those players are now, the 2026 schedule, and the record of every champion since 2006. We compared their numbers to the market only after the fact.
Where The Money And The Models Split
The agreement at the top is real and it is worth naming first. Every one of the eight models made the Rams the single most likely champion, and none of them went above 14 percent doing it. That ceiling is deliberate: a title still requires surviving three or four single-elimination games after the regular season, and a roster advantage that looks enormous in September gets compressed by a bracket that only has to go wrong once.
Below that, the two boards stop resembling each other. The market's second tier is Buffalo, Seattle, Baltimore and Kansas City. The models' second tier is New England, Seattle, Buffalo, Houston and Denver. Baltimore went 8-9 last season and Kansas City went 6-11, and neither made the postseason; both still trade above the 14-3 team that reached the final. Across 20 seasons, 18 of the 20 champions had made the playoffs the year before, at an average point differential of plus-118. The models leaned hard on that history. The board is leaning on something else.
The Board
The narrow view first, built to read on a phone. Every model's individual number is in the next table.
| Team | 2025 finish | Market | AI Median |
|---|---|---|---|
| Los Angeles Rams | 12-5, lost NFC Championship | 15.5¢ | 12.5% |
| New England Patriots | 14-3, lost the title game | 4.5¢ | 11.4% |
| Seattle Seahawks | 14-3, won the title | 7.5¢ | 8.7% |
| Buffalo Bills | 12-5, lost in the divisional round | 7.5¢ | 7.8% |
| Houston Texans | 12-5, lost in the divisional round | 4.5¢ | 6.3% |
| Denver Broncos | 14-3, lost AFC Championship | 4.5¢ | 6.0% |
| Jacksonville Jaguars | 13-4, lost in the wild-card round | 2.5¢ | 5.2% |
| Philadelphia Eagles | 11-6, lost in the wild-card round | 4.5¢ | 4.5% |
| Kansas City Chiefs | 6-11, missed the playoffs | 5.5¢ | 4.3% |
| Detroit Lions | 9-8, missed the playoffs | 3.5¢ | 4.0% |
| Baltimore Ravens | 8-9, missed the playoffs | 6.5¢ | 3.8% |
| San Francisco 49ers | 12-5, lost in the divisional round | 4.5¢ | 3.5% |
| Cincinnati Bengals | 6-11, missed the playoffs | 4.5¢ | 1.5% |
| Dallas Cowboys | 7-9-1, missed the playoffs | 4.5¢ | 1.0% |
| Rest Of The Field | 18 more teams | 0.5¢ To 4.5¢ | 2.5% or less each |
Trade the number on ProphetX.ProphetX is a peer-to-peer sports exchange with prices shown as percentages, the same scale as the cents on this page. New users: Trade $50, Get $75 with code ODDS2. 18+, availability varies by state.
Every Seat's Number
Eight models, each producing one probability distribution across all 32 teams that adds to 100 percent. The blend we quote is the median of the eight numbers, not the average, because a median is harder for one outlying model to drag. "Gap" is that median minus the market's fair value, which is the price rescaled so the whole board adds to 100 rather than the 105 cents it actually sums to.
| Team | Market | Fair | Fable | Opus | Sonnet | GPT | Gemini | GLM | Kimi | DeepSeek | Median | Gap |
|---|---|---|---|---|---|---|---|---|---|---|---|---|
| Los Angeles Rams | 15.5¢ | 14.8% | 12.1 | 12.0 | 13.5 | 12.5 | 12.5 | 14.0 | 12.0 | 12.5 | 12.5% | −2.3 |
| New England Patriots | 4.5¢ | 4.3% | 11.4 | 11.2 | 12.4 | 11.5 | 12.0 | 13.0 | 11.0 | 11.0 | 11.4% | +7.1 |
| Seattle Seahawks | 7.5¢ | 7.1% | 8.2 | 10.0 | 9.8 | 8.0 | 9.0 | 9.0 | 8.0 | 8.5 | 8.7% | +1.6 |
| Buffalo Bills | 7.5¢ | 7.1% | 7.6 | 7.0 | 8.3 | 7.5 | 8.5 | 8.0 | 8.0 | 7.5 | 7.8% | +0.7 |
| Houston Texans | 4.5¢ | 4.3% | 6.2 | 6.2 | 6.2 | 6.5 | 8.5 | 6.0 | 6.5 | 6.5 | 6.3% | +2.1 |
| Denver Broncos | 4.5¢ | 4.3% | 5.8 | 6.0 | 6.2 | 6.0 | 6.0 | 5.5 | 6.3 | 5.5 | 6.0% | +1.7 |
| Jacksonville Jaguars | 2.5¢ | 2.4% | 4.7 | 4.8 | 5.7 | 5.0 | 8.0 | 7.0 | 4.3 | 5.5 | 5.2% | +2.9 |
| Philadelphia Eagles | 4.5¢ | 4.3% | 4.8 | 4.7 | 4.6 | 5.0 | 4.0 | 3.0 | 4.5 | 3.5 | 4.5% | +0.3 |
| Kansas City Chiefs | 5.5¢ | 5.2% | 4.7 | 4.5 | 4.1 | 4.5 | 2.0 | 4.2 | 5.0 | 4.0 | 4.3% | −0.9 |
| Detroit Lions | 3.5¢ | 3.3% | 4.5 | 4.2 | 3.6 | 3.8 | 2.5 | 3.5 | 5.0 | 5.0 | 4.0% | +0.7 |
| Baltimore Ravens | 6.5¢ | 6.2% | 3.5 | 3.5 | 3.1 | 4.0 | 4.0 | 5.0 | 3.5 | 5.0 | 3.8% | −2.4 |
| San Francisco 49ers | 4.5¢ | 4.3% | 3.2 | 4.0 | 3.6 | 3.5 | 5.5 | 2.5 | 3.5 | 3.5 | 3.5% | −0.8 |
| Green Bay Packers | 3.5¢ | 3.3% | 3.0 | 3.0 | 2.6 | 2.6 | 2.0 | 2.0 | 2.0 | 2.5 | 2.5% | −0.8 |
| Chicago Bears | 3.5¢ | 3.3% | 3.0 | 2.5 | 2.1 | 2.8 | 2.5 | 2.5 | 2.5 | 2.0 | 2.5% | −0.8 |
| Los Angeles Chargers | 4.5¢ | 4.3% | 3.0 | 2.5 | 1.3 | 2.7 | 2.5 | 2.0 | 2.0 | 2.5 | 2.5% | −1.8 |
| Indianapolis Colts | 1.5¢ | 1.4% | 1.7 | 2.2 | 1.9 | 1.5 | 1.5 | 1.5 | 2.0 | 1.5 | 1.6% | +0.2 |
| Cincinnati Bengals | 4.5¢ | 4.3% | 2.0 | 1.6 | 1.5 | 1.4 | 1.0 | 1.2 | 1.5 | 2.0 | 1.5% | −2.8 |
| Minnesota Vikings | 1.5¢ | 1.4% | 1.1 | 1.5 | 1.5 | 1.8 | 1.0 | 1.5 | 1.5 | 2.0 | 1.5% | +0.1 |
| Atlanta Falcons | 0.5¢ | 0.5% | 1.5 | 1.2 | 1.2 | 1.4 | 0.5 | 2.0 | 1.5 | 2.0 | 1.4% | +1.0 |
| Pittsburgh Steelers | 1.5¢ | 1.4% | 1.1 | 1.2 | 1.3 | 1.6 | 1.5 | 1.0 | 1.0 | 1.5 | 1.2% | −0.2 |
| Dallas Cowboys | 4.5¢ | 4.3% | 1.3 | 1.2 | 1.0 | 1.3 | 0.5 | 1.0 | 1.0 | 1.0 | 1.0% | −3.3 |
| Tampa Bay Buccaneers | 1.5¢ | 1.4% | 1.1 | 1.0 | 1.0 | 0.8 | 0.5 | 0.8 | 1.0 | 1.0 | 1.0% | −0.4 |
| Carolina Panthers | 0.5¢ | 0.5% | 0.9 | 0.8 | 0.6 | 1.0 | 1.0 | 0.6 | 0.8 | 0.5 | 0.8% | +0.3 |
| Washington Commanders | 1.5¢ | 1.4% | 0.8 | 0.9 | 0.5 | 0.6 | 0.5 | 0.5 | 0.8 | 0.5 | 0.6% | −0.9 |
| New York Giants | 1.5¢ | 1.4% | 0.5 | 0.6 | 0.6 | 0.4 | 0.5 | 0.4 | 0.7 | 0.5 | 0.5% | −0.9 |
| Miami Dolphins | 0.5¢ | 0.5% | 0.5 | 0.3 | 0.4 | 0.5 | 0.5 | 0.4 | 0.7 | 0.5 | 0.5% | +0.0 |
| New Orleans Saints | 0.5¢ | 0.5% | 0.3 | 0.3 | 0.3 | 0.5 | 0.5 | 0.4 | 0.7 | 0.5 | 0.5% | −0.0 |
| Cleveland Browns | 0.5¢ | 0.5% | 0.5 | 0.2 | 0.2 | 0.4 | 0.5 | 0.3 | 0.6 | 0.5 | 0.4% | −0.0 |
| Arizona Cardinals | 0.5¢ | 0.5% | 0.4 | 0.2 | 0.3 | 0.3 | 0.2 | 0.3 | 0.5 | 0.3 | 0.3% | −0.2 |
| New York Jets | 0.5¢ | 0.5% | 0.3 | 0.1 | 0.2 | 0.3 | 0.1 | 0.3 | 0.5 | 0.3 | 0.3% | −0.2 |
| Las Vegas Raiders | 0.5¢ | 0.5% | 0.3 | 0.2 | 0.2 | 0.1 | 0.1 | 0.3 | 0.5 | 0.3 | 0.2% | −0.2 |
| Tennessee Titans | 0.5¢ | 0.5% | 0.3 | 0.2 | 0.2 | 0.2 | 0.1 | 0.3 | 0.6 | 0.3 | 0.2% | −0.2 |
| Numbers are model estimates, not predictions of fact and not financial advice. The median column adds to 99.0 as printed rather than exactly 100, because a column of medians is not itself a distribution. Each individual model's own 32 numbers do add to 100 before the one-decimal rounding you see here. Every number in this piece gets graded in public once the game settles, next to our full record on the model verdict scoreboard. |
Every seat on this panel is graded against real market settlements — records to date: Claude Fable 82% on 576 graded calls · Claude Opus 83% on 646 graded calls · Claude Sonnet 82% on 624 graded calls · GPT 84% on 5,658 graded calls · Gemini 86% on 4,423 graded calls · GLM 81% on 2,437 graded calls · Kimi 82% on 2,414 graded calls · DeepSeek 80% on 2,462 graded calls. Recomputed daily; the full scoreboard is public.
More live boards from the same panel: the NFL best regular-season record board has the Rams out front at 14¢, the NFL playoff qualifier board prices New England to reach the postseason at 64¢, and the team-level version of this question sits on our Buffalo Bills title page. Prices fetched August 22, 2026.
New England, The 14-3 Team The Board Discounted
This is the widest model-market gap on the board, so the record context comes first: when this panel disagrees with the market by this much, the market has settled right about two-thirds of the time - and that record is public and graded. What follows is what the models see anyway, on the record.
The Patriots finished 2025 at 14-3 with a plus-170 point differential, third in the league behind only Seattle and the Rams. They beat the Los Angeles Chargers 16-3, then Houston 28-16, then Denver 10-7 in the conference final, and lost the title game 29-13. Drake Maye finished first in the NFL in quarterback rating at 113 and fourth in passing yards at 4,394. Mike Vrabel won Coach of the Year and is still their head coach. Kevin Byard, who led the league with seven interceptions for Chicago, is on their roster now.
That is a full contender profile, and the market has it tied for sixth, level with seven other teams. Every model independently refused to go there. The lowest New England number on the entire board was 11.0 percent, from two separate models; the highest was 13.0. GPT laid out why it put the Patriots almost level with the Rams, and why it capped both:
New England is nearly equal at 14-3/+170, with Drake Maye first in quarterback rating, Mike Vrabel as Coach of the Year, and Kevin Byard moving in. I do not push either above the low teens because even a top seed can easily lose one game.
— GPT
Written the way a sportsbook would write it, four and a half cents is about a +2100 shot and 15.5 cents is about +545. The models are saying those two numbers should be far closer together than the board has them.
Los Angeles, Where Myles Garrett Changed The Math
The Rams earn their price honestly, and the models said so. They went 12-5 with a plus-172 differential, beat Carolina and Chicago in the postseason and lost the conference final to Seattle 31-27. Matthew Stafford won MVP after leading the league with 4,707 passing yards and 46 touchdowns. Puka Nacua led the NFL in receptions with 129. Davante Adams led it in receiving touchdowns with 14. Sean McVay is still the head coach.
Then there is the single loudest roster change in the sport. Myles Garrett led the NFL with 23 sacks in 2025 and won Defensive Player of the Year for Cleveland. He is on the Rams' roster today, alongside Byron Young, who finished tenth in sacks with 12. GLM built its whole board around that:
The Rams adding DPOY Myles Garrett to an already +172 PD roster with the MVP quarterback is the strongest single talent concentration on the board, and single-elimination caps even that at ~16%.
— GLM
The models still price the Rams a couple of points below the market, and the reason they gave was consistent. A title needs three or four straight single-elimination wins, and no roster survives that reliably enough to justify a high-teens number. Matthew Stafford's age is the second brake: he is 38 and in his eighteenth season, and Kimi named that as the only thing keeping the Rams where they are.
Only Stafford's age keeps them at 12 rather than higher.
— Kimi
Seattle, And The One-In-Nineteen Problem
Seattle won it all at 14-3 with a league-best plus-191 differential, and Jaxon Smith-Njigba won Offensive Player of the Year. On the raw tape they were the best team in football. The models still put them third.
Two fetched facts do the work. First, in the 20 seasons from 2006 through 2025, a defending champion repeated exactly once in 19 chances. Second, Kenneth Walker III, the Super Bowl LX MVP, is on the Kansas City roster now. The models did not treat either as fatal, and Opus kept the highest Seattle number on the board at 10.0 percent, but the pull was in one direction on all eight cards.
Teams The Panel Rates Higher Than The Market: Denver And Houston
Denver was the AFC's top seed at 14-3 and lost the conference final by three points, and it trades at four and a half cents. The models lifted the Broncos to 6.0 percent, but several of them flagged the same wrinkle: that 14-3 came with a point differential of only plus-90, thinner than Buffalo's plus-116, Houston's plus-109 and Jacksonville's plus-138. Sonnet made the point directly:
I flag Denver as the board's most overrated-by-record team: a 14-3 mark paired with only +90 PD (below Buffalo's, Houston's, even Jacksonville's) signals a team that won a lot of close games, so I price them alongside HOU/BUF rather than as a clear #4.
— Sonnet
Jacksonville is the same trade one tier further down. The Jaguars went 13-4, put up a plus-138 differential, and lost a one-score wild-card game to Buffalo. The board has them at two and a half cents, seventeenth. The models' median is 5.2 percent, and Gemini went as high as 8.0. Houston picks up a smaller lift for a related reason: a 12-5 season plus the softest 2026 schedule of any contender, with opponents who won 47.4 percent of their games last season.
The regular-season version of this same argument is priced directly on our NFL best record board.
Teams The Market Rates Higher Than The Models: Dallas, Cincinnati, Baltimore
Three teams trade at contender prices off seasons that were not contender seasons. Dallas went 7-9-1 with a minus-40 differential and sits at four and a half cents; the models put the Cowboys at 1.0 percent, the widest negative gap on the board. Cincinnati went 6-11 with a minus-78 differential and trades at the same four and a half cents; the models say 1.5 percent. Baltimore went 8-9 at plus-26 and trades at six and a half cents, fourth on the board; the models say 3.8 percent.
What is notable is how little argument Dallas drew. Not one of the eight wrote a line explaining why the Cowboys deserved a lower number; they simply never appeared in anyone's reasoning, which is its own kind of verdict from a set of models that were instructed to defend their numbers. Cincinnati at least got argued down. In the first round GLM weighed the Bengals' talent against their season and came out on the side of the record — "Cincinnati at 2% reflects Burrow/Chase talent against a -78 PD and easiest schedule (0.450), but the base rate dominates" — then cut them further, to 1.2 percent, after reading the rest of the room. Baltimore was different: several models raised the Ravens deliberately, and that case is in the next section.
Dark Horses The Panel Won't Dismiss
Under the headline names, four teams drew real numbers rather than a rounding error, each for a stated reason.
-
Kansas City Chiefs (4.3 percent median, market 5.5¢). A 6-11 record with a plus-34 point differential is a record built on close losses, not a bad roster; the differential was better than four playoff teams'. Patrick Mahomes and Andy Reid are both still there, and Kenneth Walker III arrived from Seattle. Four of the eight models named the Chiefs as their dark horse, and Kimi put them highest at 5.0 percent. Sonnet went along part of the way and then stopped short, noting that the history says a jump like that usually needs a new head coach or a new quarterback, and Kansas City has neither.
A 6-11 record hides a +34 point differential — better than four playoff teams — with Mahomes and Reid unchanged and Super Bowl MVP Kenneth Walker III now on the roster; I price it above a naive record read but below forecasters who treated roster additions as satisfying the card's named-coach/QB exception test, which strictly Kansas City does not meet.
— Sonnet
-
Baltimore Ravens (3.8 percent, market 6.5¢). Jesse Minter is the new head coach, John Harbaugh is now coaching the New York Giants, Lamar Jackson finished fourth in quarterback rating at 104, Derrick Henry ran for 1,595 yards, and the 2026 schedule is the ninth-softest in the league at a .479 opponent win rate. Three models named the Ravens as their dark horse, and two of them, GLM and DeepSeek, put Baltimore at 5.0 percent on that combination.
-
Indianapolis Colts (1.6 percent, market 1.5¢). Opus went highest here, at 2.2 percent, and was the only model to write the case out. It is the sharpest single-team argument on either round: an 8-9 record hiding a plus-54 differential, Jonathan Taylor leading the NFL in both rushing touchdowns (18) and total touchdowns (20), Daniel Jones inside the top ten in quarterback rating, Shane Steichen retained, and one of the easiest schedules in the conference.
-
Detroit Lions (4.0 percent, market 3.5¢). Detroit went 9-8 and missed the bracket, but did it with a plus-68 point differential better than playoff-bound Philadelphia's, Jared Goff third in quarterback rating at 105, and one of the six softest 2026 schedules in the league at a .467 opponent win rate. Kimi and DeepSeek both put the Lions at 5.0 percent, and DeepSeek was explicit that the record was the wrong read: "Detroit's +68 differential, Goff's elite production, and soft .467 schedule justify 5%, though the lack of a new QB/coach caps them per the exception rule."
Where The Panel Changed Its Mind
After the first round, each model read the other seven's numbers and reasoning with the names stripped off, and could revise. Two of them changed their top team.
DeepSeek moved the furthest. It opened with New England first at 11.9 percent and Seattle all the way down at 4.0, having leaned hard on the one-in-nineteen repeat rate and Walker's departure. After reading the others it flipped the Rams into first at 12.5 and more than doubled Seattle to 8.5, while cutting Kansas City from 9.5 to 4.0. Its closing summary of the Rams case:
The Rams' +172 differential, MVP Stafford, and addition of DPOY Myles Garrett make them the most complete team, but single-elimination caps them at 12.5%.
— DeepSeek
Sonnet made the same switch more gently, trimming New England from 14.5 to 12.4 and lifting the Rams from 12.5 to 13.5, which is still the second-highest Rams number on the board. Kimi did not change its favorite but raised New England from 8.0 to 11.0 after seeing how far above it the rest of the room had the Patriots.
| Model | Team | Round one | Round two |
|---|---|---|---|
| DeepSeek | New England | 11.9 | 11.0 |
| DeepSeek | Los Angeles Rams | 11.0 | 12.5 |
| DeepSeek | Seattle | 4.0 | 8.5 |
| DeepSeek | Kansas City | 9.5 | 4.0 |
| Sonnet | New England | 14.5 | 12.4 |
| Sonnet | Los Angeles Rams | 12.5 | 13.5 |
| Kimi | New England | 8.0 | 11.0 |
| GPT | New England | 11.5 | 11.5 |
The most interesting card belonged to the model that did not move. GPT held New England at exactly 11.5 percent in both rounds and said why:
I used the other forecasters mainly as checks on missed evidence: Garrett to LAR, Byard to NE, Walker to KC, and Devin White to DET were already in my model, so I did not move toward their consensus mechanically.
— GPT
That is what a revision round is supposed to look like. Two models found evidence they had underweighted and moved; one confirmed it had already priced the same facts and stayed put.
What Would Change The Panel's Mind
Every model was asked to name the checkable things that would move its board. Four came up repeatedly.
- Any Confirmed Stafford Absence, From An Injury Report To A Visible Early-Season Decline. Named by seven of the eight as the single biggest lever, and it points one way: the Rams down, New England and Seattle up.
- Kansas City's First Month. A healthy Mahomes and a productive Walker through September is the exact evidence the models said would justify moving the Chiefs from 4 percent toward 8. A slow start confirms the 6-11 read and takes them lower.
- Seattle Replacing Walker's Production. Several models tied their Seattle discount specifically to that departure. A running back producing at that level by October narrows the gap between Seattle and the top two.
- New England's Defense In The First Four Games. The Patriots' 2026 schedule is one of the harder ones among contenders, at 53.1 percent opponent win rate. An early defensive collapse takes New England down and pushes Buffalo and Houston up; holding up sends the gap in this article wider still.
The Traps: Big Gaps That Are Not Clean Edges
Not every gap is an opportunity. The models are working from a record of what happened in 2025 plus today's rosters, and they cannot see injuries, offensive-line quality, contract situations or coordinator hires. That matters most at the two ends of the board.
At the top, the Dallas and Cincinnati rows look enormous in percentage terms, but a contract that goes from four and a half cents to one cent is a small amount of money moving, and no model argued Dallas down at all; it simply got ranked out. At the bottom, 15 teams trade at a halfpenny or a penny and a half, and the models put every one of them under 2 percent to match. The tiny gaps there are noise, not signal. The rows where the two sides genuinely disagree on the same visible information are New England, Jacksonville, Baltimore and Denver, and those are the ones worth arguing about.
Hottest Prediction Markets Right Now
- 2028 Democratic presidential nominee · $188M traded
- 2028 U.S. Presidential Election winner? · $61M traded
- 2028 Republican presidential nominee · $59M traded
- Pro Baseball Champion · $58M traded
- Bitcoin price at the end of 2026 · $32M traded
- 2027 Pro Basketball Champion · $25M traded
Every market above links to our full AI model verdict; browse them all on the OddsShopper prediction markets hub, and see how every settled call actually scored on the full graded scoreboard.
How To Read These Prices
Kalshi lists each team as its own yes/no contract, so a New England contract bought at four and a half cents pays one dollar if the Patriots win the championship and nothing if they do not. Every contract carries a bid, which is the highest price anyone is currently willing to pay, and an ask, which is the lowest price anyone is currently willing to sell at. The prices in this article are the midpoint of those two, which is the fairest single number to quote.
Add all 32 midpoints together and you get 105 cents rather than 100. That extra five cents is the spread built into the board, and it is why comparing a raw price to a model estimate is misleading. Divide any price by 1.05 and you get its fair value: the Rams' 15.5 cents becomes about 14.8 percent, Seattle's 7.5 becomes about 7.1, and New England's 4.5 becomes about 4.3. That rescaled figure is the "Fair" column above.
Two practical cautions. Nine teams trade at a zero bid against a one-cent ask, which is a listed price rather than a real two-sided quote, so treat every halfpenny number as noisier than the heavily traded favorites. And the 2026 season has not kicked off, so this whole board is an early market that will move a great deal once games are played. Prices on this page refresh as the market moves, with the as-of date above carrying the evidence.
Settlement Timeline
| Settles | On or around February 14, 2027, once the championship game is played |
| Next Catalysts | Regular season kicks off in early September 2026 · trade deadline in early November 2026 · playoff field and seeding set in early January 2027 · conference championship games in late January 2027 |
| Re-Scored | This board is re-scored whenever the story moves; all numbers and prices above are as of August 22, 2026 |
FAQ
Who is the favorite to win Super Bowl LXI? The Los Angeles Rams, on both boards. Kalshi prices them at 15.5 cents, worth about 14.8 percent once the whole market is rescaled, and our price-blind AI models make them the favorite too at a 12.5 percent median.
Which team do the models disagree with the market about most? New England. The Patriots trade at four and a half cents, worth roughly 4.3 percent, while the models' median is 11.4 percent and no individual model went below 11.0.
Why don't the 32 prices add up to 100? Each team is a separate yes/no contract with its own bid and ask, so the midpoints sum to about 105 cents. Divide any price by 1.05 to get its fair probability.
When does the 2027 Pro Football Champion market settle? Super Bowl LXI is played in February 2027, and each contract is expected to settle on or around February 14, 2027.
Can I trade this market? Kalshi is a CFTC-regulated event-contract exchange open to users who are 18+ and located in an eligible state. Availability varies by state and changes over time, so check Kalshi's current rules first. Nothing here is financial advice.
More on this: NFL 2026 on Kalshi: 49 Live Boards, 10 Days To Kickoff · Bills Super Bowl Odds: What An 8-Cent Share Pays · La Liga Odds 2026-27: Rodri To Barca, Mourinho To Madrid · 2030 World Cup Odds: Why The USA Is Priced Above Norway · College Football Championship Odds: Texas Took Over Late
The Bottom Line
The 2027 championship board is one of the cleanest disagreements this market has produced. Both sides make the Los Angeles Rams the favorite, and both get there through the same door: an MVP quarterback, the league's second-best point differential, and the reigning Defensive Player of the Year arriving on the roster. From there the boards come apart. The models spend their next-largest share on New England, a 14-3 team with the league's top-rated quarterback and the reigning Coach of the Year that the market prices level with two teams that went a combined 13-20-1, and they refuse to pay contender prices for the Cowboys, Bengals and Ravens off losing seasons. Those are model estimates, not predictions of fact and not financial advice, and every one of them gets graded in public once Super Bowl LXI is decided. To be explicit: this is analysis of a CFTC-regulated event-contract market for readers 18+, not financial advice and not a recommendation to trade.
For the season-long versions of the same question, see our NFL best record board and NFL playoff odds board, and see how every settled call has scored on our model verdict scoreboard.
Hero illustration: OddsShopper, in the house collage style. Mike Vrabel photo by Walker Kinsler, licensed CC BY-SA 4.0; photos cropped, toned, and composited.