Sides and totals are hard mode. By kickoff, a Chiefs spread has been bet, sharpened, and re-bet by every serious operator in the market, so the number you see is close to the truest number that exists. That is not where a repeatable edge lives. The edge lives one layer down, in the dozens of player-prop markets a single game hangs, because no book can sharpen every rushing line, every reception total, and every anytime-touchdown price the way it sharpens the one spread everyone is staring at.
This is the article about attacking that layer with a process instead of a hunch. Betting NFL props with projections means one thing: you build a fair price for a player, you compare it to the number the book actually posted, and you bet only when the gap pays you. Do that consistently and the props board stops looking like a menu of guesses and starts looking like a list of prices, some of them wrong in your favor. That is the whole game, and the prop I keep coming back to every week, a dual-threat quarterback's rushing yards, is the cleanest example of why the process beats the eyeball. We will get there.
In Summary
- The Thesis: NFL player props are among the least efficient markets on the board. A projection-driven process can find edges there because books rarely price 30 player lines per game as tightly as they price one spread.
- The Board Is Uneven: on one September 15, 2026 pull, the NFL screen carried 141 player-prop market types, but 21 of the 89 receiving-yards lines had a single price source behind them. Depth decides whether an edge is even measurable.
- The Bridge (Both Sites, One Workflow): a projection is just a fair probability. Stokastic's NFL Sims and projections produce the probability; the OddsShopper odds screen shows you which book is pricing that same player wrong. One feeds the other.
- The Four Steps: Project the number, price it as fair odds, shop every major sportsbook for the best line, then size to the edge. Bet only when the shopped price beats your fair price.
- Where It Hits Hardest: dual-threat QB rushing yards, target-hog receiving yards versus a bottom-five pass defense, the over on a boom-bust receiver's longest reception, and anytime touchdowns tied to inside-the-ten work.
- The Discipline: re-project on every injury and inactive, never bet into a stale number, and treat the closing line as your scorecard. +EV means positive expected value, a price that profits over time, not a lock.
New to the mechanics of the markets themselves? Start with NFL player props explained and come back. This piece assumes you know what the markets are; it teaches you how to find the mispriced ones.
Why NFL Props Are Where The Edges Actually Live
Betting is a market, and like any market it gets more efficient the more money runs through it. The Sunday spread is the deepest, most-bet number in American sports. Sharp originators set it, the public bets into it, and by the time it closes it has been corrected a dozen times. Fighting it is fighting the entire market's combined information, and whatever you are thinking is already in the line.
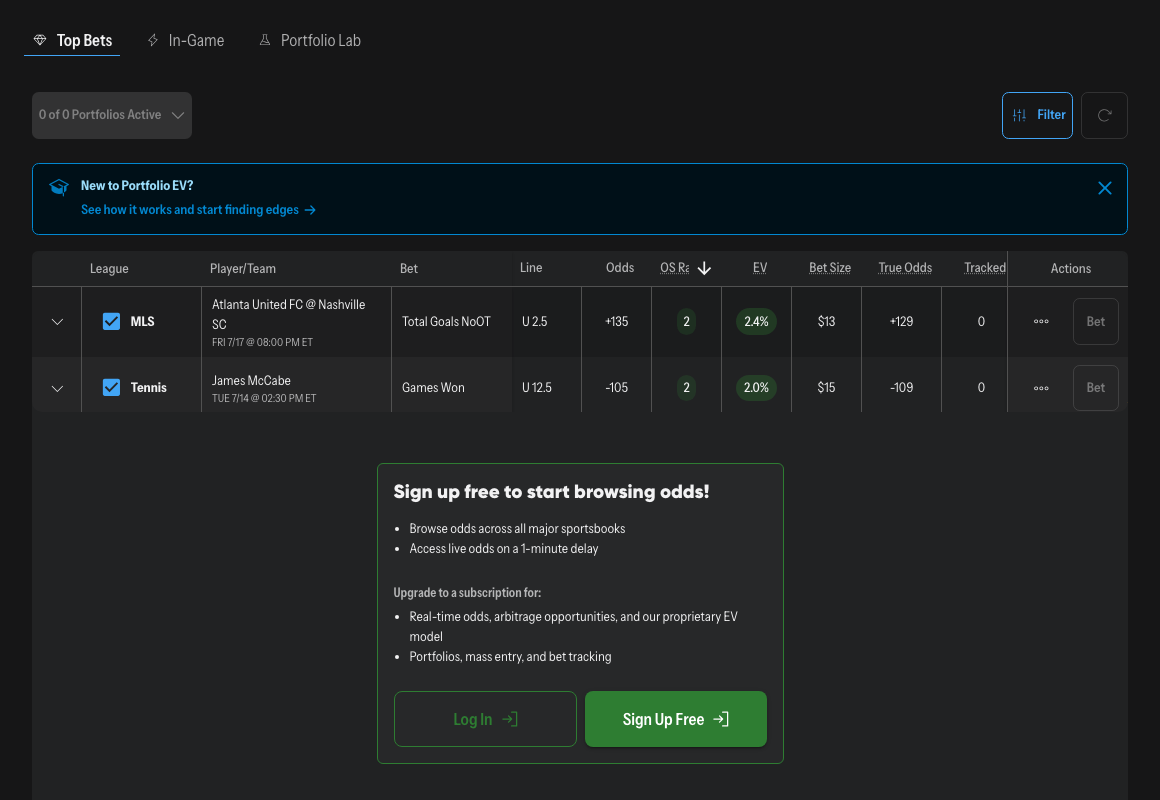
The OddsShopper +EV Screen.
Props are the opposite. A single NFL game posts a rushing-yards line, a receiving-yards line, a receptions line, and an anytime-touchdown price for two or three dozen players, and it does that for as many as 16 games a week. Those are thousands of individual prices, most of them derived from a formula and left alone unless real money forces a move. The books simply do not have the liquidity or the attention to make every one of them sharp. Derivatives and props are where edges survive precisely because main lines are where they die.
That inefficiency is the reason this article exists, and it is the fact I will keep coming back to: because the book cannot sharpen 30 player lines the way it sharpens one spread, the player line is where your own number can be more right than theirs. Hold onto that, because it is exactly why the quarterback-rushing prop later gets posted low enough to bet.
Two quick guardrails before the process. First, thresholds still matter, but props have their own, not the spread's. The three-and-seven key numbers come from common final margins; a prop's key number is market-specific, like the whole-number usage bands a receptions line clusters around or the goal-line role that decides an anytime-touchdown price. Getting a half-point on the right side of the number that actually matters for that market is worth real money. Second, props are not a license to bet more; they are a place to bet more precisely.
How Deep Is The Board? What 141 Markets And One Pull Showed
The board is bigger than most bettors think, and far more uneven. When I pulled OddsShopper's live NFL catalog early on September 15, 2026, the player-prop category carried 141 distinct market types: passing, rushing and receiving yards, receptions, total touchdowns, longest reception, sacks, tackles, first touchdown scorer, and a long tail behind those. That is the screen's aggregate catalog across every source it carries, and no single book prices all 141. But the books that do compete on props are each pricing dozens of player lines per game, as many as sixteen games a week, mostly off a formula. That volume, not any single market, is why the previous section is true.
But not all 141 of those markets are actually shoppable, and that unevenness is where an NFL player props strategy either works or quietly bleeds. On that same pull, the Total Receiving Yards board had 89 player lines posted across 16 Week 2 games, and the number of price sources standing behind each line varied enormously.
| Receiving-Yards Rows (Sept. 15, 2026 Pull) | Price sources on the row | What that means for you |
|---|---|---|
| 7 Rows, All In The Thursday Lions-Bills Game | 28-30 | Well covered: lots of quotes, a no-vig consensus worth trusting, and a correspondingly smaller edge |
| 55 Rows | 4-8 | The normal working range: usually enough quotes to find an outlier, provided the two-way books are among them |
| 6 Rows | 2 | Barely a market. Two quotes is not a consensus |
| 21 Rows | 1 | Nothing to shop. One posted price, and nothing to measure it against |
Read the bottom row twice, because it is the one that should change your behavior. Nearly a quarter of that board, 21 rows of 89, was a single source quoting a single number into a vacuum. You cannot line-shop a market with one price in it, and you cannot de-vig one either, because there is no second opinion to strip the margin against. It is not a bet with a hidden edge; it is a bet with an unmeasurable one. So here is the working rule I take from that table, and note that it is deliberately stricter than the table itself: the buckets count raw sources, but what I need is two-way books. Fewer than four of those on a row and I do not have a fair price, so I wait.
Wait for what? Mostly for the clock, and this is the useful half of the snapshot. All seven of the deepest rows sat in the Thursday night game, under three days from kickoff. Of the 21 one-source rows, 19 sat in Sunday windows five days out, one in the Monday nighter, and just one in that same Thursday game. Boards thicken as kickoff approaches. One pull cannot prove that a given row filled in over time, but the cross-section is hard to read any other way: prop liquidity is not a fixed property of a market, it is a function of how close the game is, which is exactly why the shop-and-compare step of this process belongs late in the week rather than the moment a number first appears.
The clock governs whole markets, not just individual rows. On that same pull the screen carried no Total Sacks rows at all outside the Thursday game: eight player rows, one game, eight price sources across the entire market, and only three of those (DraftKings, FanDuel, and one Ontario book) were traditional sportsbooks. Row depth inside it ran from one source to seven. Receiving yards in that same Thursday game pulled 30 on its deepest row. Same screen, same night, same game, four times the price discovery on one market as the other.
One honest caveat on the word sources, because it decides how much any of these counts are worth. That list of 30 is not 30 sportsbooks. It mixes traditional books (DraftKings, FanDuel, Caesars, Bet365, BetRivers, Fanatics), sharp and low-hold operators (Pinnacle, NoVig, OnyxOdds), exchange and prediction-market venues (Kalshi, ProphetX, Rebet), and pick'em apps (PrizePicks, Underdog, Sleeper, Dabble, Fliff). Some entries are the same operator twice, like HardRock and HardRockOH or BetRivers and SugarHouse, and Pick6 is DraftKings' own pick'em brand sitting a row away from DraftKings itself. The pick'em apps matter most: they post a pick, not a two-way American-odds market, so they cannot be de-vigged at all. Count the two-way books before you trust a no-vig number, not the raw source count. One more thing that list should tell you: a book can be all over the game-line board and completely absent from a player-prop board on the same night. BetMGM priced 32 of the moneylines on that pull and posted not a single receiving-yards or rushing-yards line, which is the thesis of this article showing up as a missing row rather than a soft one. So because every figure here moves week to week and hour to hour, treat the table above as one timestamped look at the NFL receiving-yards board rather than a permanent fact about it.
All of which leaves the one question none of these counts answer: how often does this player actually clear the posted number? The next section turns that into a price.
The Bridge: Turning A Projection Into A Fair Price
Here is the concept that connects a projection model to a betting card, and it is simpler than it sounds. A raw projection is a mean, an expected stat line. It becomes a betting probability only once you run it through a distribution and ask how often the player clears the posted number. That is exactly what a simulation does: model a running back's rushing yards thousands of times and you get, say, a 58% chance he clears 60.5. That 58% is your fair probability. Convert it to a price and you get roughly -138 in American odds. The conversion for anything above 50% is to divide the probability by its complement and multiply by 100, then make it negative: 58 over 42, times 100, is about -138 (probabilities below 50% become plus-money instead). A perfectly efficient book would post exactly that, no margin attached. Everything else is just comparing your -138 to what the market actually did.
Now watch the gap open up. Say a book hangs that back's rushing over at -115. That price implies about 53.5%. You think the real answer is 58%. You are being paid as if the outcome is close to a coin flip on a bet you win almost three-fifths of the time. Over $100 risked at -115, that edge is worth roughly 8% in expected return, not a fortune on one bet, but a genuine, repeatable one. Repeatable is the entire point.
There is one more step the sharp does that the recreational bettor skips: strip the vig before you trust the market's number. Suppose the same prop is over -115, under -105. Those two prices imply 53.5% and 51.2%, which sum to 104.7%. The extra is the book's built-in margin: a 4.7% overround, which is a 4.5% hold once you state the margin as a share of the total rather than of the stake. De-vig it (divide each side by that total) and the market's true read on the over is about 51.1%, not 53.5%. So the honest comparison is your 58% against the market's no-vig 51%, a 7-point edge, not the four-and-a-half-point mirage the raw price suggested. This is why the fair-odds engine on the OddsShopper odds screen matters. It runs that de-vig on every market automatically, so you are always measuring your projection against the market's real opinion instead of against its margin.
A nuance worth stealing from how we run the prop tool: do not bet 100% off the raw model. A sensible default is to blend the Stokastic projection with the market-based number, weighting them roughly evenly when you are pricing a bet well ahead of kickoff, then leaning harder on the Stokastic number, closer to 80/20, when the projections have just updated on fresh injury news and you trust your read over a stale market. The blend is a humility setting. It says the market knows things too, until you have a specific reason to trust your model more.
The Four-Step Process (A Worked Walkthrough)
Everything above collapses into four repeatable steps. Here is the full loop on one prop, start to finish, using our 58% running back.
| Step | What you do | On our example |
|---|---|---|
| 1. Project | Pull the fair projection from Stokastic's NFL Sims, which simulate the game thousands of times to produce a distribution, not a single guess | 58% to clear 60.5 rushing yards |
| 2. Price | Convert the probability to American odds. That is your true price, zero margin | 58% becomes about -138 |
| 3. Shop | Compare every major sportsbook for the best available number on that exact bet | DraftKings 🎁 -125, FanDuel 🎁 -115, BetMGM 🎁 -108; you take the -108 |
| 4. Size | Bet a measured fraction of your bankroll, scaled to the size of the gap | Fair -138 vs -108 taken is a clear edge; bet a unit |
The one row that decides the season is step three. On the same bet, BetMGM's -108 versus DraftKings' -125 is a meaningful swing in long-run return, and it is free: same player, same outcome, better price. Line shopping is not a nicety, it is where a big share of the profit actually comes from. Now you have the machine: project, price, shop, size. It does not care which player, which week, or which book; it just finds the spots where a number the book left alone is a number you can beat.
The Props That Reward This Process Most
Not every prop is equally soft. The process finds edges fastest in the markets where volume is predictable and the posted number is slow to reflect a usage change, injury, or matchup shift. These four are where I trust it most.
| Prop | Why the book's number lags | What the projection catches |
|---|---|---|
| Dual-Threat QB Rushing Yards | Market anchors to "quarterbacks throw" and posts the rushing line low | A stable, volume-driven rushing floor priced conservatively |
| Target-Hog Receiving Yards | Line leans on last season's reputation, not this week's target share | A huge target share versus a bottom-five defense at his position |
| Longest Reception (Over) | Full-game yardage is volatile, so the book prices it wide | Whether one deep ball lands, when the projection reads his target depth and coverage matchup |
| Anytime TD / Inside-10 Role (The Board Lists It As Total Touchdowns; Anytime Is The Over On The 0.5 Rung) | Priced off season totals, not this week's goal-line usage | Real scoring probability from red-zone and inside-the-ten volume |
Worth pairing that top row with what the board actually looked like on the September 15 pull, because it cuts both ways. The whole Total Rushing Yards market carried 61 player lines against receiving's 89, and 22 of those 61 had a single price source behind them: 36% of the board, against 23.6% on receiving yards. The market I check first is the thinner of the two big yardage boards that far from kickoff, and those two facts are the same fact. Thin is why the number can be beatable; thin is also why there may be nothing to shop it against until the week fills in. Its deepest rows, 29, 29 and 25 sources, all sat in the Thursday game again.
My first check every week is the top row. Remember the callback: books can't sharpen every line, so they lean on formula, and a running quarterback's rushing floor is remarkably stable while the posted number sits low because the market assumes quarterbacks pass. Before I bet the over, though, I want the projection to have accounted for the things that actually move a QB's rushing floor: his designed-run and scramble volume (a QB who runs by scheme is far safer than one who runs only when a play breaks down), the game script the spread implies (a home dog or a close number keeps him upright and running longer, while a two-touchdown favorite may sit late), the opponent's pass rush (pressure forces scrambles, which quietly adds rushing yards), and how sensitive the price is to the exact number, since these lines often sit at soft thresholds where a yard or two of buffer matters. When the projection clears the posted line after all of that, and the price hasn't caught up, that is the bet. A stable true floor priced conservatively is exactly the mispricing the process is built to catch, which is why it is the first prop I check every week.
The thread connecting all four is that opportunity (snaps, targets, carries near the end zone) is more predictable than the book's number assumes. That predictability is what a projection captures and a hunch cannot. And every one of these markets sits on the OddsShopper board with its de-vigged fair price already computed, so the gap between your projection and the market is a number you can read rather than one you derive by hand.
Reading The Odds Screen Like A Sharp
The projection tells you what to bet. The odds screen tells you where, and it is the half of the workflow most bettors do worst. A few habits separate the process from a coin flip:
- Line-Shop Every Bet Across Every Major Sportsbook. The same prop is rarely priced the same at DraftKings, FanDuel, BetMGM, and Caesars. OS Pro surfaces the best available number so you never leave EV on the table by betting the first book you opened.
- Read The No-Vig Fair Odds, Not The Raw Price. The screen strips the hold for you, so you compare your projection to the market's real opinion instead of to its margin.
- Sort By +EV, Then Throw Out The Thin Rows. The +EV screen ranks props by projected expected value (estimated ROI and model-implied win probability, not historical results or guaranteed win rates), the fastest way to see where your kind of edge already exists before you even open your own model. Then apply the depth rule from that Sept. 15 pull: an expected-value number computed off one or two quotes is measuring almost nothing, and on that board 27 of the 89 receiving-yards rows were in exactly that state.
- Watch The Line-Movement History. If a number is steaming toward your side, the market may be agreeing with you. If it steamed away and you are chasing it, that is often the market telling you your projection is stale.
Run the process on every NFL prop.OS Pro line-shops every major sportsbook, de-vigs each market to its fair price, and ranks the board by +EV, so the gap between your projection and the market is a number you can read at a glance. Use code NFLPROJ20 for 20% off. See the odds screen →
This is also where OddsShopper's positioning is different from the field. A guide tied to a single sportsbook can only ever show you that one book's price. OddsShopper is book-agnostic. It compares the same prop across the books it supports, which is the only honest way to line-shop. Your projection is the edge; the player-prop odds screen is the tool that converts the edge into an actual, best-priced bet. For a broader read on treating price as the product, how to bet like a pro covers the same discipline across every market.
The Traps That Kill Projection-Driven Bettors
A good process fails in predictable ways. These are the ones that quietly wreck otherwise-sharp NFL prop bettors.
- Betting Into A Stale Projection. The single most important thing on the prop tool is the "last updated" timestamp. If a starter got ruled out an hour ago and the projection hasn't refreshed, you are betting a number that no longer exists. Re-project after every injury and inactive report, because a stat line means nothing if the touches just got vacated.
- Chasing The Number After It Moves. If you liked the over at -115 and it is now -140, the value you identified is gone. The bet was the price, not the player. Let it go. The mirror-image error is treating a lonely early-week number as sharp just because it is posted: a one-source Sunday line five days out has not been corrected by anyone yet.
- Ignoring Game Script. A back on a double-digit favorite may lose fourth-quarter carries to the clock; a receiver on a trailing team gains garbage-time volume. Derive the script from the spread and adjust the projection before you trust it. Script risk compounds the thin-liquidity problem above, because it bites hardest on exactly the rows nobody has corrected: a one-source line posted five days out has not priced in a script read that the spread will not settle for another four days.
- Buying Alt-Line Rungs To Force An Edge. Climbing to a longer alt number to "get better odds" usually just pays more vig on each rung. The books rake alts aggressively, and a straight bet at the projected number is almost always the cleaner play.
- Fighting The Closing Line. Closing line value is the honest scorecard: your price versus the final market number. If you consistently beat the close, your process is working even on the weeks you lose. If you consistently bet worse than the close, no result masks that the projection is behind the market.
Notice these are all discipline failures, not model failures. The projection can be right and the bet can still be bad if you time it wrong, size it wrong, or chase it. The process is the model plus the habits.
FAQ
What does "betting NFL props with projections" actually mean? It means using a projection model to build your own fair probability for a player outcome, converting that probability into fair odds, and betting only when a sportsbook's posted price is better than your fair price. The projection finds the edge; the odds screen prices and places it.
Do I need a DFS subscription to bet props this way? No, but the projection is the engine, so a real model helps. Stokastic's NFL Sims and projections are built for exactly this (they already power our own betting), and the OddsShopper odds screen is where you turn that projection into a best-priced bet. The two sides of the workflow feed each other.
What is +EV and why does it matter more than winning percentage? +EV means positive expected value, a bet priced better than its true probability, so it profits over the long run even though any single bet can lose. You can win a bet that was -EV (bad price) and lose a bet that was +EV (good price). Chasing +EV, not chasing wins, is the only defensible long-term process, though the edge only plays out over a large sample and short-run variance can bury even a disciplined +EV bettor for stretches.
Which NFL prop is the best starting point? Dual-threat quarterback rushing yards are often my first check. Designed-run rate, scramble rate, and spread-driven game script can open cleaner projection gaps than a box-score bettor expects, and the volume tends to be steadier than the posted number assumes. Deep-dive the mechanics in NFL rushing yards props.
How is this different from just betting the best players in good matchups? "Best player, good matchup" is a hunch with no price attached. The process attaches a price. It tells you the fair number, compares it to the market, and passes on the bet, even on a star in a smash spot, if the price isn't there. Value is price versus true probability, not the shortest-odds favorite.
The Bottom Line
So here is the whole method as a single decision rule you can run on any prop: do not bet the projection, bet the gap. If your model says 58%, the no-vig market says 51%, and the best available price still pays better than your fair number after the injury report has updated, that is a bet. If any one of those three pieces breaks, if the price already moved, the market caught up, or the touches got vacated, you pass. No hunch, no narrative, no chasing.
That rule is why the softer props layer is a durable place to work rather than a lucky streak. A projection turns information into a fair price; the player-prop odds screen turns that fair price into a found bet; and the gap between them, when it survives the injury report, is the only edge worth building a process around.
Turn your projections into best-priced bets.OS Pro line-shops every major sportsbook and shows the de-vigged fair odds on the NFL player props it covers, so the gap between your number and the market is a real, actionable price. Use code NFLPROJ20 for 20% off. Start with OS Pro →
More on this: NFL 2026 on Kalshi: Every Board We Track · NFL Coach Of The Year Odds: Kalshi Fades A Two-Time Winner · NFL Picks Hub: Week 1 Odds, Win Totals, Props · NFL Win Totals 2026: Kalshi Vs DraftKings Vs FanDuel · Kalshi Vs Polymarket NFL: Why The Cheaper Fee Loses