Market prices on this page were fetched from Kalshi on August 26, 2026, with the S&P 500 at 7,675.10. The AI panel's numbers were generated the same morning, price-blind, and stay frozen at that snapshot so every call can be graded honestly against what the market does next. Check Kalshi for live prices before acting on anything here.
S&P 500 Positive In 2026 Odds: The Only Way It Finishes Red
Updated August 26, 2026 · 12 min read · by Eric Lindquist
Most year-end market questions are arguments about a target. This one is an argument about a floor, and the floor is a number that already happened.
Kalshi lists a contract on whether the S&P 500 finishes 2026 positive, and it settles above 6,845.50. That is not a round number somebody picked. It is the exact level the index closed at on December 31, 2025, pulled from the daily S&P 500 price series that every historical figure on this page is computed from. So the contract is the calendar year itself, reduced to one line, with four months left to defend it.
The Only Way 2026 Finishes Red
The index closed August 25 at 7,677.28 and sat at 7,675.10 when we fetched this board. Call it a 12.1% gain on the year. For the "positive" contract to fail, the S&P 500 has to give all of that back and then some: a decline of about 10.8% from here, landing at or below 6,845.50 on the December 31 close.
There are roughly 87 trading sessions between now and that close, based on the median count for this stretch of the calendar over the last ten years. So the question is not "will stocks wobble." Stocks wobble constantly. The question is whether the entire year's advance disappears inside 87 sessions and stays gone through the final bell.
A word on how these prices work, because the format trips people up the first time. A Kalshi contract pays $1.00 if the outcome happens and nothing if it does not, so the price in cents reads almost directly as a probability: 85 cents is the market saying roughly 85%. Our guide to reading Kalshi prices as probabilities covers the wrinkles, including what the trading fee does to your real break-even. Kalshi is a CFTC-regulated event-contract exchange, participation is 18+, and availability varies by state.
We ran this contract past six AI models without showing any of them the price. Their numbers, the 75-year ledger that shaped them, and the one seat that stayed well below the rest are further down.
Stay ahead of the markets.
Daily insights and expert picks on Kalshi, Polymarket, and what's moving markets.
Free forever. Unsubscribe anytime.
What Would Actually Have To Break
The bear case here is not vague, and it is not ours. It belongs to Bank of America's Savita Subramanian, who carries the lowest published year-end S&P 500 target on Wall Street at 7,100. Her argument, as reported in June, is that seven of the ten bear-market signposts BofA tracks had triggered as of May. The same report describes her pointing to extreme concentration in the technology sector, where the performance gap between the top and bottom performers has reached levels the report compares to the dot-com bubble. Her own words to clients were pointed: "We see opportunity in S&P 500 stocks, but not the overall cap-weighted index."
Every panelist picked that up. Concentration is the mechanism that turns a sector problem into an index problem, and this index is unusually exposed to one story.
The calendar cooperates with the bears in the short run. Nvidia reports fiscal second-quarter results after the close today, with the street looking for $2.09 per share on $92.2 billion of revenue, up 97.4% year over year. Fed Chair Kevin Warsh gives his first Jackson Hole keynote as chair on Friday, August 28 at 10:00 a.m. ET, at a symposium themed on financial innovation and payments. And the Federal Reserve's own published calendar has three more policy meetings before this contract settles: September 15-16, October 27-28, and December 8-9, the first and last of which carry updated economic projections.
That is a real list of ways the next four months could go wrong. Here is the problem with turning it into a year-end call: some version of that calendar, an earnings event that could break the leadership trade and a Fed that could surprise, exists in every one of the 75 years we are about to walk through. The index still had to fall 10.8% in four months for the bears to be right.
Seventy-Five Decembers
We computed this from the full daily S&P 500 series, every session from January 1950 through this morning. Nothing sampled, nothing rounded off a memory.
Since 1951, the index has finished above the prior year's close in 55 of 75 calendar years. That is 73.3%, and it is the number most people would guess. It is also the wrong starting point, because it treats late August as if we knew nothing about how the year has gone.
Condition on what we do know and the picture changes hard. In the 30 years where the S&P 500 was up 10% or more through this same calendar date, it finished the year positive 30 times. Thirty for 30. The typical rest-of-year move in those years was another 6.2% gain. Only three of the 30 ever traded back to flat-on-the-year at any point after late August, and the deepest of those, 1978, only got 2.7% under water before recovering.
Run the requirement directly and you get the same answer from the other side: across those 75 years, the index fell 10.8% or more from this date into the December close exactly four times. 1987, 2000, 2008 and 2018.
The 1987 case is the one worth telling properly, because it is the strongest bear analog in the file and it still resolved YES. By this date in 1987, the S&P 500 was up 38.2% on the year. Then came October 19. At the early-December low the index was 33.1% below its late-August level and, for a few days, 7.5% below where 1986 had ended. It closed the year at 247.08 against 242.17, a 2.0% gain, after a net slide of about 26% from that August mark. The largest four-month collapse in the modern history of the index was not enough to flip its calendar year, because of how much cushion it fell from.
The other three did not have that cushion. 2000 was up just 2.5% by late August before the dot-com unwind took it 12.4% lower into December. 2008 was already down 13.4% on the year before the Lehman quarter took another 29.0%. 2018 was up 7.5% before the fourth-quarter tightening scare erased it. In each case the fall was survivable in isolation and fatal because the year had no room.
2026 has room. It carries a 12.1% cushion, its worst drawdown from the August 13 intraday high of 7,816.70 is 1.8%, and its realized volatility sits between 11% and 14% annualized depending on the window, which is calm by any standard. That is not a promise. Thirty for 30 is a real record on a small sample, and the sample contains no year that started from an index this concentrated in one trade. Both things are true at once, and the seats below split on exactly how much weight the second one deserves.
The Board
Kalshi quotes the contract at 84 bid, 85 ask: 84 cents is the best price a buyer is currently willing to pay, 85 is the cheapest anyone will sell at. Lifetime volume is about 988,000 contracts, and roughly 455,000 of those positions are still open rather than closed out, so this is a market people actually hold. Recent flow is thin, though. About 1,300 contracts changed hands in the last 24 hours, which means a two-cent wiggle in the quote is usually one of the firms that posts prices all day adjusting its own book, not news.
Kalshi also runs a separate board on the same event, splitting the December 31 close into 27 price bands. Grouped up, here is where that board says the year ends.
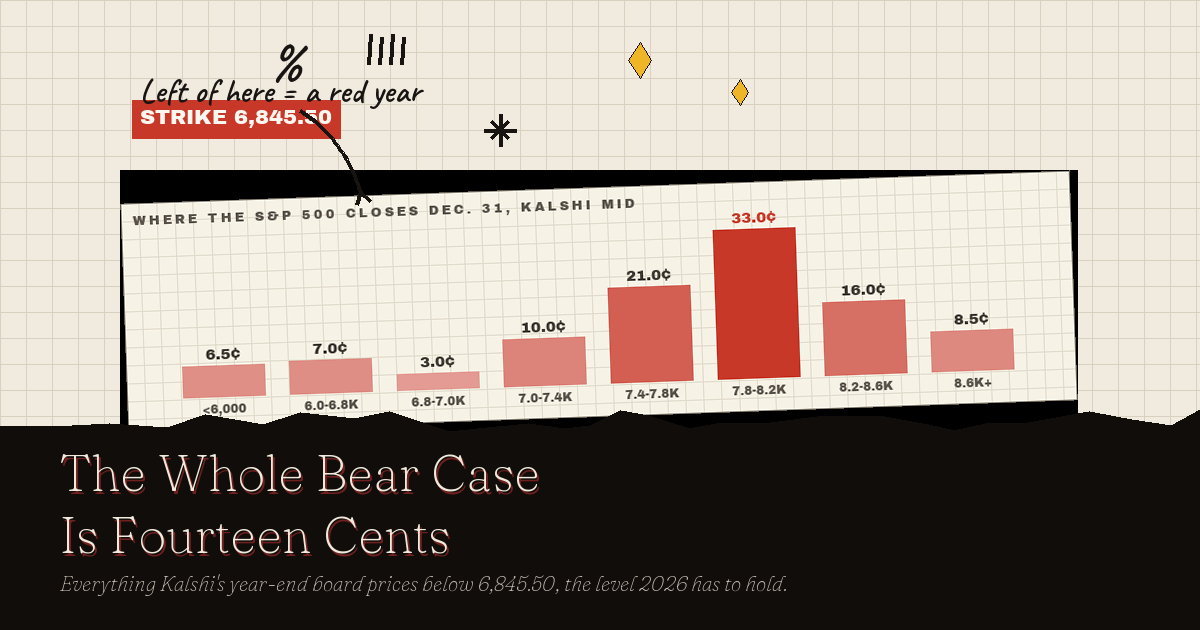
| Where The S&P 500 Closes On Dec 31 | Kalshi mid |
|---|---|
| Below 6,000 | 6.5¢ |
| 6,000 To 6,799.99 | 7.0¢ |
| 6,800 To 6,999.99 | 3.0¢ |
| 7,000 To 7,399.99 | 10.0¢ |
| 7,400 To 7,799.99 | 21.0¢ |
| 7,800 To 8,199.99 | 33.0¢ |
| 8,200 To 8,599.99 | 16.0¢ |
| 8,600 Or Above | 8.5¢ |
Those are the midpoints between each band's bid and ask, and the 27 bands sum to 105 cents rather than 100. That five-cent excess is the gap between buy and sell prices across a wide board, not free money. Read it from the bottom and the whole bear case is about 14 cents. The two rows that sit entirely below 6,800 account for 13.5 of that, and the 6,800 row spans the strike, so roughly 0.7 cents of its 3.0 belongs on the red side too. Everything above the line, including the rest of that spanning row, comes to about 90.8 cents. Normalize for the 105-cent total and the board implies roughly 86.5% on a positive year. The single contract is quoted at 84 to 85. Two separate Kalshi boards on the same December close, priced independently, land within about two points of each other.
Now the panel. Six models scored this contract on August 26 without seeing any price, working from a fetched card carrying the live index level, the full calendar-year ledger, the settlement language, and the dated news items above. Two of the panel's eight seats were unavailable for this run.
| Seat | YES probability | The one-line read |
|---|---|---|
| Claude Opus | 96% | Index sits 10.8% above the strike with 87 trading days left; at 12-13% realized volatility that decline is roughly a 2.5-sigma tail event. [Editor's note: two figures in this seat's one-line summary are off. The index sits 12.1% above the strike; 10.8% is the fall needed to reach it. And at 12-13% annualized volatility over 87 sessions, that fall is closer to 1.5 standard deviations than 2.5, which is what the seat's own longer analysis, quoted below, says. Its 96% stands as scored.] |
| Gemini | 94% | An 11% buffer above the strike and perfect historical precedents; only a severe late-year macro shock forces a negative finish. |
| Claude Fable | 92% | Only 4 of 75 years since 1951 fell that far this late, and realized volatility is low. |
| GPT | 90% | A 10.8% cushion with 87 sessions left, positive trend in the historical analogs, and consensus targets above the strike. |
| Kimi | 88% | Low realized volatility, and every year up 10%+ through this date since 1951 finished positive. |
| Claude Sonnet | 85% | A 12% gain places 2026 among the 30 analogs that finished positive every time, but the drop required is rare rather than impossible. |
| Panel Blend | 91% | seat median |
Every seat on this panel is graded against real market settlements — records to date: Claude Opus 84% on 831 graded calls · Gemini 86% on 4,952 graded calls · Claude Fable 84% on 761 graded calls · GPT 84% on 6,249 graded calls · Kimi 83% on 2,534 graded calls · Claude Sonnet 82% on 808 graded calls. Recomputed daily; the full scoreboard is public.
Model estimates generated August 26, 2026. These are model estimates, not predictions of fact and not financial advice. Models are frequently wrong; the market price reflects real traders' money. Every number in this piece gets graded in public once the market settles, which is what the full graded scoreboard is for.
The panel median is 91% against a market band in the mid-80s, a six-point spread. The honest context for that gap is our own graded record: when this panel has disagreed with a Kalshi price by ten cents or more, the price has been right roughly two-thirds of the time. The panel is a public scorecard, not a signal, and a six-cent gap is smaller than the ones it has historically lost.
More live boards from the same panel: How high the S&P 500 goes in 2026 prices an 8,000 touch at 56/66¢ · S&P 500 below 4,000 is offered at 2¢ · the Fed decision board has September's upper bound holding above 3.75% at 33¢. Prices fetched August 26, 2026.
Where The Six Seats Split
Eleven points separate the top seat from the bottom, and the disagreement is entirely about how much to trust a normal distribution in the tails.
Opus took the math at face value. "With 60d realized vol at 13.6%, the standard deviation of returns over the remaining ~87 trading days is only about 8%, making a -10.8% close a ~1.4-sigma move on a distribution that drifts upward," it wrote, before naming its own soft spot: "a genuine AI-capex repricing could cascade through an index this top-heavy."
Sonnet, 11 points lower, refused the same math on sample grounds. Its number, it said, "already sits below the pack specifically because Nvidia earnings same-day and the Warsh Jackson Hole keynote add near-term event risk the 30/30 sample doesn't isolate."
Kimi framed the split most cleanly of the six: "fat tails make the empirical 4/75 base rate more trustworthy than a normal-tail 0.96."
We then ran a second round in which every seat read the other five arguments, stripped of names, and could revise. Nobody moved a point. Gemini held on the same reasoning Kimi did, from the other direction: "equity tail risks are famously non-normal, and maintaining a 6% residual probability appropriately accounts for the fat-tailed chance of a 2018-style Q4 drawdown." A panel that reads its own opposition and holds is not a panel that has converged. It is one whose disagreement is about a modeling assumption, not about a fact any of them could hand the others.
What Would Change The Panel's Mind
Four things, each checkable, with the direction each one pushes.
- Nvidia's Guidance Tonight, And How The Market Trades It Tomorrow. Five of the six seats named this as the single most estimate-moving event on their horizon. A clear guidance miss that cracks the AI capital-spending story would hit the concentrated top of the index hardest, and pushes the number down. An in-line print takes the nearest catalyst off the board and pushes it up.
- Warsh's Jackson Hole Framework On Friday. A first keynote is where a new chair explains how he thinks rather than what the committee just did. A hawkish framework read as fewer cuts through 2027 is the 2018 rhyme the bears want, and pushes down.
- The S&P 500 Losing Its 200-Day Average, Currently Near 7,109. That level sits about 260 index points above the contract's strike and is rising. Losing it would be the first structural break in the 2026 trend and would put the strike inside one ordinary correction rather than two, pushing down hard.
- A December 8-9 Fed Meeting That Lands With The Index Still Above 7,400. At that point fewer than 20 sessions remain and the required fall roughly doubles as a share of the time left, pushing the number toward the high nineties regardless of the news.
When This Settles, And How
| Settles | On the S&P 500 close, 4:00 p.m. ET, December 31, 2026 |
| Resolves YES If | The index closes above 6,845.50. A close of exactly 6,845.50 pays NO |
| Next Catalysts | Nvidia earnings Aug 26 (after close) · Jackson Hole Aug 27-29, Warsh keynote Aug 28 · FOMC Sept 15-16, Oct 27-28, Dec 8-9 |
| This Page | Re-scored when the story moves. Prices and panel as of August 26, 2026 |
Two settlement details are worth knowing before the last week of December, because both are unusual and neither is obvious from the market title.
The first is who calls it. Kalshi's contract terms for this family say plainly that "The Source Agency is Kalshi," and the market's secondary rules add that "the Exchange has modified the Source Agency and Underlying for indices markets." The exchange settles its own index contracts. The public API lists a settlement source too, but only as "For example, Google Finance," which is a hint rather than a binding citation. Only regular-hours prints count: the terms restrict the measurement to "traditional market hours (9:30 AM - 4 PM ET)," so a wild after-hours tape on New Year's Eve is irrelevant.
The second is that late revisions do not count. "Revisions to the Underlying made after Expiration will not be accounted for in determining the Expiration Value." Whatever the December 31 close reads at 4:00 p.m., that is the number.
Hottest Prediction Markets Right Now
- 2028 Democratic presidential nominee · $194M traded
- 2027 Pro Football Champion · $72M traded
- 2028 U.S. Presidential Election winner? · $62M traded
- Pro Baseball Champion · $61M traded
- 2028 Republican presidential nominee · $60M traded
- Bitcoin price at the end of 2026 · $33M traded
Every market above links to our full AI model verdict; browse them all on the OddsShopper prediction markets hub, and see how every settled call actually scored on the full graded scoreboard.
More on this: Where Does Bitcoin End 2026? Kalshi's Price-Band Odds · World Series Odds: Lindy Vs. The Machine · Nurmagomedov Vs Song Odds: Not SO Fast On Umar · 2026 Senate Races: Every Kalshi Board We Track · Kalshi Venezuela Leader Odds: Who Holds Power In 2026?
The Bottom Line
The market prices a positive 2026 in the mid-80s. Our panel, blind to that price, lands at 91%, and the six seats split over whether a calm 12% year deserves the normal-distribution answer or the fat-tailed one.
What both sides agree on is the shape of the thing. To finish red, 2026 has to lose everything it has gained since January inside four months, and the four times that has happened since 1951 all came with a named cause: a crash out of a melt-up, a bubble unwinding, a banking collapse, and a tightening scare. Three of those four started from years with almost no cushion. The one that started rich, 1987, took the worst four months on record and still finished green.
The bear case here is not that the market is fragile in general. It is Subramanian's specific one, that an index this concentrated in one story can fall further and faster than its own volatility history suggests. Nvidia's guidance tonight and Warsh's framework on Friday are the first two chances anyone has to find out.
To be explicit about what this page is: these are model estimates, not predictions of fact and not financial advice. Kalshi is a CFTC-regulated exchange, participation is 18+, and availability varies by state. Every call above is graded in public when the market settles, win or lose.