In thinly traded prediction markets, contracts priced under 15¢ settled YES far less often than their price said, and contracts priced from 35¢ to 95¢ settled more often. In heavily traded markets, that gap disappears. We know because we graded 1,861 settled Kalshi contracts, priced July 20 to August 10, 2026, against the price showing when our AI panel priced them. The price also beat our own eight-model panel almost everywhere, so where prediction markets are sharp and where they are soft is not a question of subject. It is a question of volume and price band.
Almost nobody tests their private theory about which boards price honestly, because testing it takes two things most people never keep: a forecast recorded before you saw the price, and a settlement to grade it against. We keep both. Our panel prices markets blind, its numbers land in a database the moment they are made, and the exchange tells us later who was right.
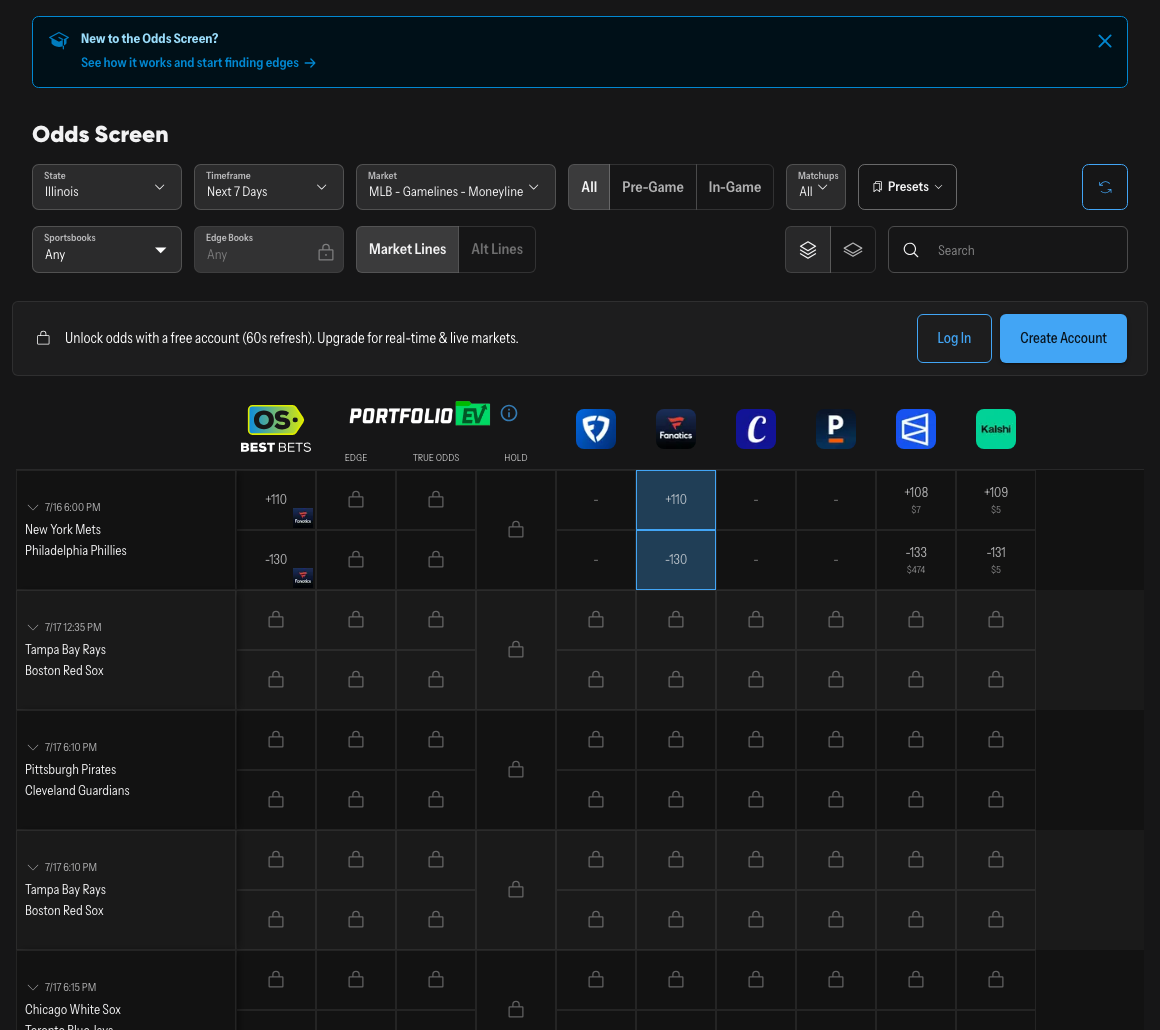 The OddsShopper live odds screen — every book's price on one board, refreshed in real time. Open the live board.
The Quick Answer
Across 1,861 settled contracts, the market price was more accurate than our eight-model panel. It had the lower score in seven of eight categories, and across the full sample its advantage holds up statistically.
The market's accuracy is not evenly spread, though. In deeply traded markets, every leftover distortion we tested has a confidence interval that includes zero. In thinly traded markets, contracts under 15¢ were priced about 4 points too rich and contracts between 35¢ and 85¢ about 8 points too cheap. That is the favorite-longshot bias, and it lives in a price band rather than a subject. The thin-versus-deep price table, the eight-category scorecard, and three checks that tell you which kind of book you are looking at are below.
Stay ahead of the markets.
Daily insights and expert picks on Kalshi, Polymarket, and what's moving markets.
Free forever. Unsubscribe anytime.
What We Actually Measured
Every market our panel covers gets priced by each model without the market price in the prompt. The model sees a data card of fetched facts and the settlement rules, and it commits to a number. That number, the market price at that moment, and the settlement date all go into a database. When the contract settles, the row gets graded.
For this study we took every contract that met four conditions: it has settled, at least three panel seats priced it, we recorded the market price at the time we asked, and the market was still retrievable from Kalshi's API when we ran the study. That is 1,861 contracts across 886 distinct events. All of them were priced between July 20 and August 10, 2026, and they span sports, crypto, weather, economics, entertainment, politics and a long tail of everything else. YES came in on 47.6% of them, so the sample is not lopsided toward either side. The panel number in every comparison below is the equal-weight mean of the seats that priced that market, which we call the blend.
The general case for prediction markets rests on decades of academic comparisons against polls, which we walk through separately in are prediction markets actually accurate. This piece is the narrower question that literature cannot answer for you: not whether the crowd is good, but where its price stops being reliable.
Two limits before the numbers. First, this is our covered set, not the exchange: we write about markets we find interesting, which skews toward contracts with a story. Second, three weeks is a short window. Both push in the direction of treating the size of every effect below as provisional and the direction as the finding.
Finding One: The Price Beats The Panel
Not close, and not only on average.
| Category | Contracts | Market Brier | Panel Brier |
|---|---|---|---|
| Crypto | 392 | 0.0891 | 0.0990 |
| Sports | 387 | 0.1398 | 0.1525 |
| Everything Else | 302 | 0.1453 | 0.1448 |
| Weather | 281 | 0.0967 | 0.1147 |
| Economics And Finance | 246 | 0.0770 | 0.0995 |
| Entertainment | 116 | 0.0300 | 0.0390 |
| Mentions And Speech | 86 | 0.1387 | 0.1564 |
| Politics And News | 44 | 0.0560 | 0.0651 |
Seven election-specific contracts are left out of that table, because seven is too few to score a category on and printing a Brier number for them would imply a precision we do not have. The 44-contract politics and news bucket holds the non-election political and news markets. The seven are included in every full-sample figure below.
Brier score is the standard way to grade probability forecasts: square the distance between your number and what happened, average it, and lower is better. A forecaster who says 90% and is right loses 0.01; one who says 90% and is wrong loses 0.81. It punishes confident errors, which is exactly what you want from a scoreboard. It measures overall accuracy, rewarding both honest probabilities and the willingness to move off the middle. Calibration, the narrower question of whether contracts priced at 9¢ actually settle 9% of the time, is what Finding Three below measures, and the two can come apart.
Across the full set the market scored 0.1058 and the panel 0.1178. On the simpler question of which side to be on, the market picked the eventual winner 84.2% of the time and the panel 82.7%. We also resampled the whole set by event, so a fifteen-rung weather ladder counts as one observation instead of many. On that basis the market's advantage is 0.0119 Brier points, with a 95% confidence interval of 0.0073 to 0.0173. It never touches zero. The one category where the panel edged ahead is the miscellaneous bucket of lower-tier tennis, minor-league soccer totals and one-off oddities, and it edged ahead by 0.0005, which is a rounding error wearing a trophy.
- Every number in this piece gets graded in public once the market settles, and you can read the running tally on the full graded scoreboard.
Hottest Prediction Markets Right Now
- 2028 Democratic presidential nominee · $176M traded
- 2028 U.S. Presidential Election winner? · $58M traded
- 2027 Pro Football Champion · $58M traded
- 2028 Republican presidential nominee · $56M traded
- Pro Baseball Champion · $51M traded
- More tech layoffs in 2026 than in 2025? · $31M traded
Every market above links to our full AI model verdict; browse them all on the OddsShopper prediction markets hub, and see how every settled call actually scored on the full graded scoreboard.
Finding Two: Disagreement Is Not An Edge
The tempting inference from a model that disagrees with a market is that the model found something. Our data says the opposite, and it says it loudly.
One hundred and 47 contracts drew a disagreement of 15 points or more between the panel and the price. Split them by which side the panel took.
| Panel Priced | Contracts | Market Price (Avg) | Panel Number (Avg) | YES Settled | Panel's Side Won |
|---|---|---|---|---|---|
| Above the market | 54 | 24¢ | 55 | 33.3% | 18 of 54 |
| Below the market | 93 | 82¢ | 50 | 90.3% | 9 of 93 |
When the panel priced above the market, YES came in a third of the time: the panel's side, but well short of the panel's number and closer to the market's. When the panel priced below, nine in ten contracts cashed anyway. Pool the two piles and the panel's side won 27 of 147, which is 18.4%.
The daily scoreboard says the same thing from a different angle and on a larger sample: measured per seat, across every market where a model disagrees with the price rather than only the 15-point gaps, hit rates run between 25% and 43%. Not one seat clears a coin flip.
This is why we treat a large model-versus-market gap as an editorial signal, the thing that makes a market worth writing about, and never as a trading signal. A gap means the models and the crowd are reading different information. In our record, the crowd is usually the one reading it correctly.
Finding Three: The Soft Corner Is A Price Band Inside A Thin Book
Now split the same contracts by how much each market traded. We pulled the traded volume for all 1,861 markets from Kalshi's API on August 11 and cut the sample at its median, 53,868 contracts. One note for anyone repeating this: the API's plain volume field came back empty on all 1,861 markets, and empty values sum to a confident zero. The real numbers live in volume_fp and the dollar-denominated fields.
| Contract Price | Thin books: priced, settled (n) | Deep books: priced, settled (n) |
|---|---|---|
| Under 5¢ | 2.5¢, settled 0.6% (160) | 2.0¢, settled 1.7% (172) |
| 5¢ To 15¢ | 8.9¢, settled 2.3% (131) | 9.3¢, settled 7.3% (124) |
| 15¢ To 35¢ | 24.4¢, settled 19.4% (98) | 24.9¢, settled 31.5% (124) |
| 35¢ To 65¢ | 49.9¢, settled 57.1% (119) | 50.1¢, settled 49.0% (253) |
| 65¢ To 85¢ | 76.0¢, settled 85.5% (76) | 74.2¢, settled 70.1% (107) |
| 85¢ To 95¢ | 90.3¢, settled 94.3% (70) | 90.5¢, settled 86.7% (45) |
| Over 95¢ | 98.8¢, settled 97.8% (276) | 98.9¢, settled 98.1% (106) |
Contract counts are in parentheses, because the two summary figures in the next paragraph are contract-weighted averages across the bands rather than an average of the band averages, and you should be able to check our arithmetic.
Read the left column top to bottom and a pattern falls out that has a name. Everything under 35¢ settled less often than it was priced, everything from 35¢ to 95¢ settled more often, and the near-certainties above 95¢ were roughly honest. In the thin half, everything under 15¢ was priced 4.0 points too rich, with a confidence interval of 2.4 to 5.3 points, and everything between 35¢ and 85¢ was priced 8.1 points too cheap, interval 0.5 to 15.0. In the deep half both of those numbers collapse toward zero and their intervals straddle it: cheap contracts 1.0 point rich, mid-range contracts 2.0 points rich, neither distinguishable from an honest price. The one deep-book row that looks alarming on its own, the 15¢-to-35¢ band settling 31.5% against a 24.9¢ price, does not survive its own error bars either: that gap runs from minus 1.5 to plus 14.5 points, and the thin-book version of the same band runs from minus 12.7 to plus 3.3. Neither says anything.
That left column is the favorite-longshot bias, the pattern first measured at American racetracks in the late 1940s and replicated at bookmakers many times since, which our own weather research log covers in more depth. In this historical sample, longshot prices sat above their settlement rates and favorite prices sat below. Finding that pattern alive on a 2026 electronic exchange, and finding it confined to the markets nobody is watching, is the most useful thing in this data.
More live boards from the same panel: The Winds of Winter release date at 9¢ on 45,775 contracts traded, a thin book sitting in the band this table flags · Super Bowl 2027 champion with the Rams at 13¢ on 8.3 million contracts, a deep one · the graded scoreboard for every call we have made. Prices fetched September 14, 2026.
One confound worth killing, because the thin half is heavy on weather and economic ladders while the deep half is heavy on sports. Split each category at its own median volume instead, then pool: thin-within-category cheap contracts still ran 3.1 points rich, interval 1.6 to 4.8, while the liquid-within-category version came in at 1.9 points rich with an interval that includes zero. The direction repeats inside crypto, weather, finance and entertainment on their own. It does not appear in sports at all, and the likely reason is that sports barely has a thin half to test: only 9% of our sports contracts fell below the sample-wide median, and the median sports market had traded 547,084 of them.
Why The Two Halves Behave Differently
A price is only as good as the argument behind it, and in a deep book the argument is enormous. Thousands of people with money at stake, some of them professionals whose entire job is finding a two-cent error, keep re-testing every level. Being wrong is expensive and being right is profitable, so the errors get arbitraged out faster than they appear.
In a book that has traded a few thousand contracts, the price is a handful of orders, which is the practical meaning of prediction market liquidity. Nobody is paid to keep it honest. The people who show up are disproportionately the ones who want the outcome, or want the story, and a lottery-shaped payoff attracts buyers at a price no seller would take if anyone competent were paying attention. The leading explanation we would test next for the shape of the left column is the tick size. Kalshi prices move in whole cents, so at a 2¢ price the smallest adjustment anyone can make is a 50% change in the price. Nobody can build a small, proportional margin into a contract that cheap, which is a plausible reason the thin sub-5¢ row misses by under 2 points in absolute terms while the 5¢-to-15¢ row misses by 6.6. In relative terms the bottom row is still off by a lot, so this is an argument about where a few cents of margin can hide, not a claim that the deepest tails are clean. A bias needs room to hide in, and there is more of it in a dime than in a nickel. That is a hypothesis our data is consistent with rather than a mechanism we have isolated.
It is worth being blunt about what this does and does not mean for a reader. A pattern where 8.9¢ contracts settle 2.3% of the time is a historical calibration gap of a few cents, and gaps that small are the ones real-world costs eat first. Kalshi's fee schedule works out to about 0.6¢ per contract at that price, roughly a tenth of the gap; a thin book by definition may not let you out at a fair price when you want out; and outcomes in this band are lopsided by construction, so a single settlement can undo a long run of them. The calibration gap is visible in this sample. It is not a recommendation, and nothing here is a pick.
Where This Runs Against Our Own Weather Series
Our Kalshi weather markets research log has been reporting the opposite result on daily temperature ladders: that the deepest 2¢ and 3¢ cells settle more often than their price implies, with the tick size as the explanation. The two readings are measuring different objects. That series looks at ladder cells with a real two-sided quote close to expiry; this study looks at contracts our panel covered, priced a median of about 27 hours before settlement for weather, and its weight sits in the 5¢-to-15¢ band rather than the deep tail. Our own sub-5¢ weather sample here is 45 contracts, priced at an average of 2.7¢, none of which settled YES, which is far too small to referee anything in either direction. We are publishing both readings, and the disagreement between them is a live question rather than a settled one.
Does A Consensus Round Help?
After every panel prices a market, we run a revision round: each model reads the other seven rationales anonymized, and may change its number. Forty-eight settled markets have now been through both rounds with the same seats.
In those 48, the round did exactly what it was designed to do and produced no measurable accuracy gain. Average disagreement between seats fell from 2.47 points to 1.12, a 55% collapse in dispersion. Accuracy did not move: Brier went from 0.11486 before the round to 0.11501 after, a change of plus 0.00015, where positive means slightly worse, on an interval running from minus 0.0017 to plus 0.0047. The side-picking rate was 77.1% before and 77.1% after. The models talked each other into agreement without talking each other into being right. Forty-eight markets is a small sample and we will keep running it, but the early read is that consensus and accuracy are separate things, which is worth remembering the next time a room agrees with itself.
How To Check A Market Before You Trust Its Price
Three checks, in the order that matters, none of which require a model.
- Read the traded volume, not the listing. A market appearing on the exchange tells you nothing about whether a crowd priced it. Kalshi publishes the number; look for the fractional volume field, because the plain one is frequently empty.
- Read the book, not the last trade. A last price of 3¢ with no live bid or ask on either side is not a crowd verdict, it is a leftover.
- Locate the price on the ladder. In a thin market, our data says the errors cluster in cheap contracts and mid-to-high favorites. Above 95¢ they shrink to about a point. Below 5¢ they shrink to under two points in absolute terms, though at those prices two cents is still a large share of the ticket. Knowing which band you are looking at tells you how much doubt the price deserves.
What Would Change This Read
Four specific things, each of which we can check.
- NFL Season Volume. Week 1 kicked off September 10, and football volume will pull thousands of contracts across the median into the deep half. If the bias tracks volume rather than subject, the sports rows should stay clean while newly-thin markets inherit the pattern.
- A Larger Settled Sample. The interval on the thin-book mid-range effect, currently 0.5 to 15.0 points, is wide enough that its true size is unresolved. A re-run on the contracts settled since August 10 is the test that narrows it.
- A Kalshi Fee Or Tick Change. The tick-size argument for why the sub-5¢ row misses by less in absolute terms is a mechanical claim. Change the mechanics and it should break in a predictable direction.
- Market-Maker Programs Arriving In Thin Categories. Paid quoting is the single fastest way to erase this pattern, and if it arrives, the soft corner should close first in whichever category gets it.
When This Page Re-Scores
| What | When |
|---|---|
| Study Data | 1,861 contracts priced July 20 to August 10, 2026 |
| Next Re-Run | After NFL Week 1 and Week 2 volume settles, late September 2026 |
| Live Prices In This Piece | Fetched as of September 14, 2026 |
| Standing Policy | Re-scored whenever the story moves, with the new as-of stamp |
The Bottom Line
The efficient-market story about prediction markets is mostly true, and our own record is the evidence against ourselves: eight models with a fetched data card and no view of the price lost to the price, in seven of eight categories, and lost worst precisely when they were most confident the price was wrong. In this sample, deep books left almost no measured room for a better forecast to beat the price.
What survives the grading is smaller and stranger than the usual pitch. In markets almost nobody is trading, the price carries a bias that racetracks documented 80 years ago, and it lives in a specific band: cheap contracts too expensive, favorites too cheap, both effects fading as volume arrives. That is a structural feature of who shows up rather than a forecasting edge, which is why finding it required grading forecasts rather than making them.
These are market prices, historical settlement rates and model estimates, not predictions of fact and not financial advice. Everything above measures past settlements, and nothing on this page is a pick or a recommendation.
Prices on this page are Kalshi's book. If you also trade on Polymarket, code OS4 gets new users a $50 trading bonus on a $10 deposit — affiliate link; terms as stated by Polymarket; 18+, availability varies by state.
More on this: CPI Report Odds: Where Inflation Is Priced · Is Kalshi Legal In All States? Two Courts, Two Answers (2026) · Giants Win Total 2026: A 4-13 Team Priced For 7.5 Wins · Tua Tagovailoa's Falcons Job, As Priced By A Market · US Open Exacta Odds: 53 Of The 80 Pairs Are Already Dead