A passing touchdown prop looks like a question about a quarterback. It isn't. Over the last two NFL regular seasons, the average starting quarterback threw exactly 1.50 touchdown passes per game: 1.49 in 2024, 1.51 in 2025, across 1,021 starts. That number barely moves, and it is why a sportsbook posts the same 1.5 on nearly every quarterback in the league, why the only lever the book has left is the price, and why two books can hang the identical bet 51 cents apart this week without either being wrong.
The Week 3 board below proves it 17 times over. The rest of the page explains why, and names the one signal that actually moves your number.
Week 3 Passing Touchdown Props: The Board
Prices as of Wednesday, September 23, 2026, 8:02 a.m. ET, from the OddsShopper live passing touchdowns odds screen. Every quarterback with ten or more sources posting a main line, sorted by kickoff and then by the Over price. Kalshi and PolymarketUS prices are contract prices converted to American odds.
| Player | Team | Game | Line | Best Over | Best Under | Books |
|---|---|---|---|---|---|---|
| Michael Penix Jr. | ATL | ATL at GB, Thu 8:15 p.m. ET | 1.5 | +198 DraftKings | -218 PolymarketUS | 10 |
| Jordan Love | GB | ATL at GB, Thu 8:15 p.m. ET | 1.5 | -115 PointsBet | +111 NoVig | 24 |
| Aaron Rodgers | PIT | CIN at PIT, Sun 1:00 p.m. ET | 1.5 | +196 OnyxOdds | -215 Fanatics | 15 |
| Drake Maye | NE | NE at JAX, Sun 1:00 p.m. ET | 1.5 | +160 PointsBet | -170 NoVig | 17 |
| Geno Smith | NYJ | NYJ at DET, Sun 1:00 p.m. ET | 1.5 | +160 PointsBet | -191 PolymarketUS | 15 |
| Justin Herbert | LAC | LAC at BUF, Sun 1:00 p.m. ET | 1.5 | +140 Kalshi | -160 Fanatics | 21 |
| Joe Burrow | CIN | CIN at PIT, Sun 1:00 p.m. ET | 1.5 | +100 PointsBet | -113 NoVig | 16 |
| Trevor Lawrence | JAX | NE at JAX, Sun 1:00 p.m. ET | 1.5 | +100 BetRivers | -120 Caesars | 20 |
| Josh Allen | BUF | LAC at BUF, Sun 1:00 p.m. ET | 1.5 | -142 Kalshi | +129 PolymarketUS | 20 |
| Jared Goff | DET | NYJ at DET, Sun 1:00 p.m. ET | 1.5 | -199 Kalshi | +162 Caesars | 14 |
| Kirk Cousins | LV | LV at NO, Sun 4:25 p.m. ET | 1.5 | +143 Caesars | -170 Fanatics | 14 |
| Tyler Shough | NO | LV at NO, Sun 4:25 p.m. ET | 1.5 | +100 FanDuel | -107 OnyxOdds | 15 |
| Dak Prescott | DAL | BAL at DAL, Sun 4:25 p.m. ET | 1.5 | -130 PointsBet | +129 OnyxOdds | 21 |
| Lamar Jackson | BAL | BAL at DAL, Sun 4:25 p.m. ET | 1.5 | -140 PointsBet | +125 OnyxOdds | 21 |
| Bo Nix | DEN | LAR at DEN, Sun 8:20 p.m. ET | 1.5 | +126 Caesars | -145 Fanatics | 18 |
| Matthew Stafford | LAR | LAR at DEN, Sun 8:20 p.m. ET | 1.5 | -115 Underdog | +100 Fanatics | 19 |
| Jalen Hurts | PHI | PHI at CHI, Mon 8:15 p.m. ET | 1.5 | +134 DraftKings | -164 Caesars | 12 |
Books counts every source posting the main line, sportsbooks, exchanges and pick'em apps alike. Patrick Mahomes, Brock Purdy, Baker Mayfield, Kyler Murray, C.J. Stroud and Bryce Young had no wide board at pull time, two to four sources each.
Seventeen Quarterbacks, One Line
Seventeen quarterbacks with a real board and every one of them sits at 1.5. Not one book made 2.5 the main number on Burrow or Goff. The whole spread of opinion, from a quarterback the market expects to blank to one it expects to throw two, lives in the price column. The fair price for Over 1.5 at league baseline is +118, and neither end of the board is near it: Michael Penix Jr. is +198 at DraftKings across 10 sources and Aaron Rodgers +196 at OnyxOdds and DraftKings across 15, while Jared Goff's Over is -199 (Kalshi's price converts to -199; FanDuel and PointsBet are -200) and Josh Allen's is -142 (Kalshi's price converts to -142; PointsBet and Caesars are -145).
Goff is the callback. Before his Week 2 game in Buffalo, the field's most bullish de-vigged read on him was 56.9%, under the 62.5% of his own starts in which he cleared 1.5 over 2024 and 2025. This week, against the Jets, the best two-way prices (-199 and +162) de-vig to 63.6%. The market moved him from below his two-year rate to above it without touching the line.
The Widest Gap On The Board
Rodgers' Over runs from +196 at OnyxOdds and DraftKings down to +145 at Underdog. Same 1.5, same game, and $100 wins $196 at the top and $145 at the bottom: $51 for reading across one row. Underdog is a pick'em app, so if you shop sportsbooks only, the floor is Fanatics at +160 and the gap is still $36. Goff's row teaches it from the other side: laying his Over costs $199 to win $100 at the best price and $244 at Sleeper.
Shop the Under too. Dak Prescott is -130 Over at PointsBet and +129 Under at OnyxOdds, a two-way hold of 0.2% at the best prices. Take the first price at one book and you pay standard juice; take the best at each and the market is close to free.
The One Row Where The Books Split
Penix is the only quarterback on the board where the sources disagree on the number itself. Ten post 1.5, nine post 0.5, and one posts 1.0, a whole-number line where exactly one touchdown pushes. That is what a market looks like when the book wants a line between two integers and cannot have one. The 1.5 posters say it with price, +198. The 0.5 posters say it with the line. The one on 1.0 went looking for the half-step that yards markets get for free and landed on a push. Same read on the same quarterback, with no shared way to write it down.
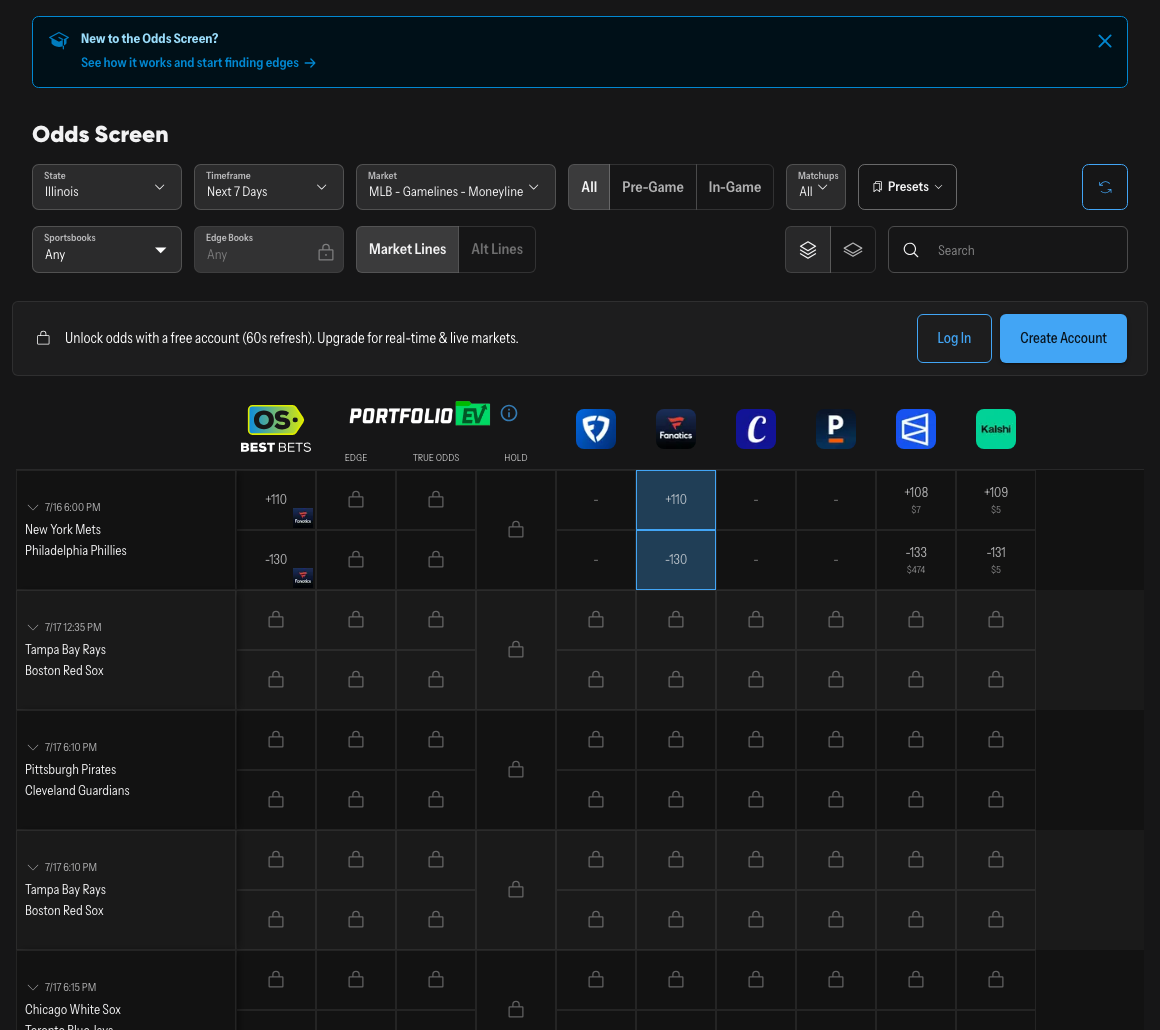
The OddsShopper Odds Screen.
New to props? Start with our guide to NFL player props or how to bet on NFL. This piece assumes you can read a price and strip the vig out of one.
Betting a Kalshi combo on this game?price any Kalshi combo before you buy it: 10,000 simulated games price every combo next to the price on Kalshi.
It's A Poisson Market, And That Explains Everything
Every start from 2024 and 2025 in which a quarterback threw at least 20 passes, 1,021 games from the public nflverse play-by-play data, next to a textbook Poisson curve fed nothing but the league average of 1.50:
| Passing TDs | Actual (2024–25) | Poisson at 1.50 |
|---|---|---|
| 0 | 21.1% | 22.3% |
| 1 | 33.0% | 33.5% |
| 2 | 28.2% | 25.1% |
| 3 | 11.7% | 12.5% |
| 4 | 4.8% | 4.7% |
| 5+ | 1.3% | 1.9% |
The row that should stop you is 0 touchdowns: 21.1%. Better than one start in five, a starting NFL quarterback throws zero touchdown passes, the best ones included, so every Over carries a one-in-five chance the bet is dead before it has a pulse. Add the bottom four rows and you get the number that prices this market: Over 1.5 hits 45.9% of the time. Under is the majority side.
Four of the six rows land within a single point of a curve that has never watched a football game and doesn't know who Josh Allen is. The one gap, 28.2% actual against 25.1% predicted on exactly two, is all of the coaching effect that survives league-wide; the rest hides in which teams throw it near the goal line. When a market sits this close to a random process, your edge cannot come from being smarter about football. It has to come from the price.
Passing Yards Moves The Line. Passing Touchdowns Moves The Price.
A passing yards prop is a continuous market: the book hunts for the number that splits the outcome in half (246.5, 247.5, 248.5) in half-yard steps until both sides sit near -110, and the line does the work. Passing touchdowns can't do that. The outcome is a whole number, there is no 1.7, and outside a blowout or a monsoon the book has two usable lines. Look at what sits between them:
- Over 1.5 → 45.9% → fair price +118
- Over 2.5 → 17.7% → fair price +464
One notch on the line is a 346-cent move in fair price with nothing in between, so a book that thinks a quarterback is a shade better than baseline cannot nudge the line. Its opinion goes into the price, and because every book faces the same wall, every disagreement between two sportsbooks also shows up as price, not line. I checked that on one quarterback in both markets. On the morning of September 15, 2026, Jared Goff's passing yards board had 14 sportsbooks posting eight different numbers, from 259.5 to 269.5, nearly all priced at -114 or -115 each way. His passing touchdowns board had 28 sources posting the identical 1.5, priced from -121 at BetRivers to -150 at Bet365. De-vigged, BetRivers had him reaching two 51.3% of the time and Bet365 56.9%, and neither could say so by moving the number.
Shop this market properly.OS Pro de-vigs every NFL passing touchdown price to a fair number, and the tool scans each book's juice on that identical 1.5 so you can see who's out of line with the field. Use code PASSTD20 for 20% off your first payment, with a 7-day free trial.
Worked Example: Pricing An Over 1.5
Three steps, and none of them start with the quarterback.
- Anchor to +118. Anything shorter means the market is telling you this quarterback is above average, this game is above average, or the book is charging you for the privilege.
- Strip the vig. A book hanging +100 implies 50% raw; de-vigged against the other side it lands near 47%, one point above baseline rather than four. The Over is rarely the bargain a plus number suggests, and the 2.5 is never one: +464 is the fair price for a 17.7% event, so take it only at a price better than that, sized as the 1-in-6 shot it is.
- Compare the books, not your gut. Every book uses the same 1.5, so the best number is a straight read across. It doesn't turn a bad Over into a good one, which is what finding a real +EV bet requires; it makes every Over you were taking anyway cheaper. De-vig the two-sided market, then take the outlier. Our live NFL passing touchdowns odds screen puts every book on one page, and the DraftKings promo, FanDuel promo and BetMGM 🎁 pages are worth a look if you need a second or third account to shop with.
The Signal: Red-Zone Pass Rate
If the quarterback's name barely moves the distribution, what does? Play calling. Across all 272 games of the 2025 regular season, 71.1% of passing touchdowns were thrown from inside the 20-yard line, 47.7% from inside the 10, and 29.5% from inside the 5. A passing touchdown prop is a bet on what a coordinator calls on 2nd-and-goal from the 4, which makes red-zone pass rate the number to check. Here is the 2025 spread; two weeks of a new season tells you who is calling the plays now, not enough to overturn a full year of tendency.
| 2025 Red-Zone Pass Rate | Team |
|---|---|
| 69.2% | Arizona |
| 61.3% | Minnesota |
| 51.2% | League average |
| 41.6% | Philadelphia |
| 40.1% | Baltimore / Washington |
Arizona threw it on 69.2% of its red-zone snaps. Baltimore and Washington threw it on 40.1%. That is a 29-point gap in how often a quarterback is even handed the chance to throw a touchdown from the only place most of them get thrown, and it towers over the gap between most quarterbacks' talent. Arizona's number isn't pure scheme, because teams that trail throw more, which is why you read it next to the game lines. Baltimore's is the mirror image: six red-zone snaps in ten, nobody throws it. A great quarterback on a team that runs it in from the 3 is a worse passing touchdown bet than a mediocre one on a team that throws it. Anytime touchdown props are the other half of the same read: they hinge on which individual gets the goal-line work, this market on whether the team throws it there at all.
How Much Does The Quarterback Actually Matter?
Some. Of the 32 quarterbacks with at least 14 starts across 2024–25, the ones furthest from the baseline, sorted by how often they cleared 1.5:
| Quarterback | Starts | Over 1.5 rate | TDs/game |
|---|---|---|---|
| Joe Burrow | 24 | 75.0% | 2.46 |
| Matthew Stafford | 32 | 65.6% | 2.03 |
| Josh Allen | 28 | 64.3% | 1.75 |
| Jared Goff | 32 | 62.5% | 2.06 |
| Jacoby Brissett | 17 | 58.8% | 1.47 |
| League Baseline | 1,021 | 45.9% | 1.50 |
| Geno Smith | 30 | 30.0% | 1.33 |
| Cam Ward | 16 | 25.0% | 0.94 |
| Spencer Rattler | 15 | 13.3% | 0.80 |
A 75% Burrow and a 13% Rattler are not the same bet. But 24 games is a season and a half, and a 75% rate over 24 starts is a noisy estimate that regresses hard toward 1.50. Burrow's Week 3 Over at +100 (PointsBet and NoVig) is the market applying exactly that regression. Two touchdowns in three straight games is the same noise from the other direction.
Then there is the quarterback who breaks the table. Jacoby Brissett cleared 1.5 in 58.8% of his starts while averaging 1.47 touchdowns per game, below the league average. A top-eight Over 1.5 quarterback and a below-average touchdown passer at the same time. The prop pays on a threshold, not the average, and a quarterback who reaches two often and blanks rarely beats 1.5 more often than a boom-bust arm with a gaudier mean. Ask how often he throws two or more, not how many he averages. Only one of those questions is on your bet slip.
The Number Was Never About The Quarterback
Two seasons, 1,021 starts, and the average never budged off 1.50. The book can't move the line, so it moves the price, and this week it did that on all 17 quarterbacks with a board. Anchor to +118. Ask whether the team throws inside the 10. Ask how often he throws two or more, not what he averages. Then take the best number on a line every book has already agreed on. Start with the live passing touchdown odds screen, check the free expert picks, and if you want the fair price computed for you, use code PASSTD20 for 20% off your first payment, starting with a 7-day free trial.
Data: nflverse public play-by-play, 2024–2025 NFL regular seasons, compiled July 2026. Week 3 board: OddsShopper's NFL Total Passing Touchdowns screen, pulled 8:02 a.m. ET on September 23, 2026; the September 15 Goff comparison was pulled 5:56 a.m. ET that day; de-vig is ours. Odds move; verify every price at your book before betting. 21+ where legal. Please bet responsibly.
More on this: Giants-Rams TD Props: 2 Mispriced Kalshi Plays For Monday · NFL Week 2 TD Props: 3 Mispriced Kalshi Plays For Sunday · Anytime Touchdown Scorer Meaning: Why QB Passes Don't Count · Falcons vs Packers Anytime TD Picks for Thursday Night · Who Will Score a Touchdown? The Likeliest Scorer Can Still Be a Bad Bet