The Quick Answer
Betting MLB home run props well is a price problem, not a talent problem. Convert the odds to an implied probability, build your own read from the hitter's barrel rate and ISO, the pitcher's pitch mix and the hard contact he allows, and a current view of the park and weather, then bet only when your price beats the fair, de-vigged number. The stats that actually predict homers, a real +525 worked example, and the discipline of beating the sharpest number on the board are all below.
Watch The Video
Here is the full MLB research show this breakdown is built on, on the OddsShopper YouTube channel. Watch on YouTube.
The OddsShopper +EV Screen.
The Price Is The Bet, Not The Hitter
The most common way to lose money on home run props is to bet the guy you are most sure will go deep. Aaron Judge is the likeliest hitter to homer on almost any night he plays, and the books know it, so his price is short and the value is gone. When I get the "who's most likely to homer today?" question, the honest answer is that I cannot answer it until I see the number next to it.
Every plus-money home run price translates to an implied probability. Bet only when your read on the hitter's real chance clears that implied number. These are the prices you actually see on dingers, and the chance each one implies:
| Home Run Odds | Implied probability | You need a true chance above |
|---|---|---|
| +300 | 25.0% | 25% |
| +400 | 20.0% | 20% |
| +500 | 16.7% | 16.7% |
| +525 | 16.0% | 16% |
| +700 | 12.5% | 12.5% |
| +900 | 10.0% | 10% |
If you stack the four or five hitters most likely to homer into a parlay without checking those prices, you are usually building a negative-EV card. A parlay multiplies the odds of its legs, so every leg priced worse than the true odds compounds the leak. Talent gets you on the board; the price decides whether the bet is good. If converting odds to probability is still fuzzy, our how to read betting odds guide walks through it.
Read The Hitter: Barrel Rate, Hard-Hit Rate, And ISO
Most home runs start as barrels: the right exit velocity at the right launch angle. So I start with the inputs that actually predict barrels rather than raw home run totals, which lag behind how a hitter is striking the ball.
- Barrel Rate And Hard-Hit Rate. How often is he squaring the ball up and hitting it hard? A hitter living in the launch-angle sweet spot with a high hard-hit rate is a home run waiting to happen, even through a quiet week.
- ISO And Expected ISO. Isolated power (slugging minus batting average) measures raw pop, and expected ISO strips out the luck. When a hitter is carrying something like a .190 ISO with a .154 expected ISO and both numbers are climbing, the power trend is real, and odds set off last month's results may lag it.
- Handedness And The Park Fit. A left-handed slugger in a yard that is short to right field is a different bet than the same hitter on the road.
The point is to find a hitter whose underlying power is trending up while his odds still reflect last month's results.
Read The Pitcher: What He Throws And What He Gives Up
The other half of a home run prop is the arm on the mound, and two numbers do most of the work.
First, how much hard contact the pitcher allows. A starter giving up a 42% hard-hit rate is handing out the exact contact quality that turns into homers. Second, his pitch mix, and what he gives up on his most-used pitch. A pitcher who throws his four-seam fastball more than half the time and allows real damage on it is vulnerable in a specific way: pair him with a hitter who punishes fastballs and you have a matchup worth pricing.
The matchup that tilts the home run odds your waya hitter whose strength is fastballs, against a pitcher who throws fastballs the most and gives up hard contact on them, in a park that lets that contact carry. That overlap is where a home run price can beat its true odds.
Here is the green-light read at a glance, both sides of the matchup:
| Side | Green light for a home run | Red flag |
|---|---|---|
| Hitter | High barrel + hard-hit rate, ISO and expected ISO trending up | Cold contact quality, ground-ball lean |
| Pitcher | Heavy use of one pitch the hitter punishes, high hard contact allowed | Misses bats, soft contact, deep arsenal |
| Park And Air | Plays up for that hitter's power, wind blowing out, warm | Wind in, cool, pitcher-friendly dimensions |
| At-Bats | Likely three trips vs the starter | Early platoon hook, blowout risk |
One caution that has cost me at-bats more than once: the late-game platoon. Target a left-handed hitter against a right-handed starter and the spot can look perfect, but if the opponent's bullpen is stacked with left-handers, your hitter may get pulled or pinch-hit for and lose a trip to the plate. Fewer at-bats means fewer swings at a home run, so check the pen before you bet the bat.
Park And Weather Move Home Run Odds (And They Shift)
Park factors are not fixed, and treating them as static is how stale reads happen. A stadium can change character from one season to the next. T-Mobile Park in Seattle, long thought of as a pitcher's park, spent much of one recent season playing up for left-handed power, something that had never been true of that building before. Kauffman Stadium tends to play up for homers once the summer humidity sets in, because warm, humid air lets the ball carry. If your mental map of a ballpark is a few years old, you are pricing the wrong park.
Weather is the same-day version of this. A high total in a game where the wind is blowing in and the air is cool is often too high, and the same conditions quietly suppress home run chances. Before you lock a dinger, check the wind direction and temperature the way you would check the starting pitcher.
A Worked Example: A +525 Home Run Price That Looked Too Long
Take a real spot from one June research show. I am keeping the names out of it, since this is a dated teaching example rather than a live pick. A left-handed hitter was sitting at +525 to homer. That price pays like a 16% chance (100 divided by 625, the 525 plus the 100). The question is only whether his true chance that day was higher than 16%.
The profile said yes. He was carrying roughly a .190 ISO with a .154 expected ISO still climbing, so the power was real and trending. The matchup fit the right way too: a left-handed bat against a right-handed starter, in a park that had been playing up for left-handed pop that season. And that starter threw his four-seam fastball more than half the time, and left-handed hitters had been punishing that pitch, the exact handedness matchup this hitter brings. Stack those inputs and a fair price looked a good deal shorter than +525, which is the whole case for the bet: the number implied 16%, and the read said the real chance was meaningfully higher.
The case was built on a power profile, a pitch matchup, and a park measured against a price, not on a feeling that he was "due" or that he is a star. That is what a measured bet looks like.
New to OddsShopper?It scans every major sportsbook and the prediction markets and de-vigs the market to an estimated fair price on any bet, so you can see a home run prop's real implied probability and spot the ones priced in your favor. Try it free for 7 days, and code HRPROPSEDGE20 takes 20% off OS Pro or OS Core if you subscribe.
Beat The Sharpest Number, Then Bet
This is the discipline that keeps a home run card honest: I will not bet a dinger unless my price beats the de-vigged fair number, and the sharpest book on the board is the closest proxy you will see to that. The sharp market carries the least margin, so if I cannot beat it, I am almost certainly taking the worst of a bad number. When some book on the board hangs a price longer than the sharp number, that is the bet worth taking.
Doing that by hand across a full board of hitters is brutal, because home run prices swing hard from book to book and the prediction markets and pick'em apps add even more numbers to compare. This is where OddsShopper does the heavy lifting:
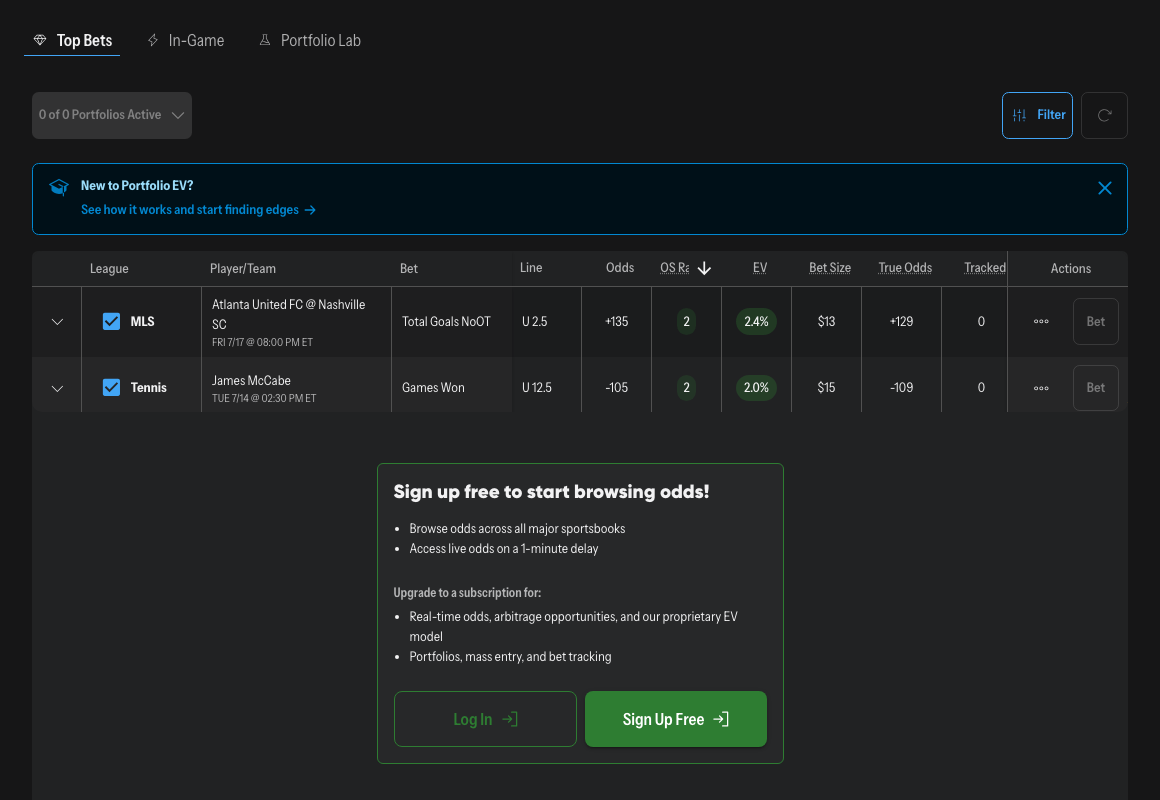
- The odds screen puts every major sportsbook, the prediction markets, and pick'em apps in one sortable place, so you can always take the best available number on the market you want. Start from the MLB odds screen and pull up the home run market from there.
- De-Vigging To The True Price is the part editorial pick lists cannot give you. OddsShopper strips the book's margin out of the market and shows the fair number, which is exactly the implied-probability target from the table above. Portfolio EV then flags when a home run prop is priced better than that fair number before you bet, rather than guessing from the raw odds. In practice the tool surfaces the props where the best available number beats that fair price, so the playable dingers come to you instead of you hunting them line by line.
That fair-number step is the edge. Anyone can list five hitters they like; the bet only works when the price beats the true odds. For the full mechanics, see our guide on finding +EV bets, and if you want to understand the margin you are stripping out, our explainer on how sportsbooks make money shows exactly where the vig hides.
Size Home Run Props Small And Judge Them Over Time
Home run props are plus-money, boom-or-bust bets. Even a sharp dinger card loses most of its individual bets, because a 16% shot misses 84% of the time by definition. Two rules keep the variance from wrecking you:
- Size To The Edge, And Keep These Small. Do not fire the same stake at a +600 home run that you would at a -150 favorite. Higher-variance, longer-odds plays get smaller units.
- Judge The Process Across A Long Sample. A profitable stretch will be followed by cold ones, and one blank evening of dingers says nothing about whether the method is working. The math needs time to show up.
The operators enforce the first rule for you more than you might expect. On the show behind that +525 example, the pick'em app capped the host at $25 on an individual player, and he ended up with $10 on the play. Limits on longshot player markets run low across the industry, so when your ceiling on a dinger is set by the operator rather than your bankroll plan, small sizing is not just discipline, it is the reality of the market.
And the quiet trap: do not get overconfident in your own edge. A great-looking profile is still a probability, not a promise, and the moment you start treating likely home runs as foregone conclusions is the moment you over-bet them. For a full staking plan built for exactly this kind of play, see how to beat the sportsbooks with a small bankroll.
The Bottom Line
Betting MLB home run props well comes down to one habit: price the hitter yourself, then refuse to bet unless the number is in your favor. Build the read from barrel and hard-hit rate, ISO and expected ISO, the pitcher's most-used pitch and the hard contact he allows, and a current view of the park and weather. Turn the price into its implied probability, beat the sharpest number on the board, size the bet small, and let a long sample do the judging. That is the whole home run prop strategy, and it is what separates MLB home run betting on math from betting on vibes.
When you want to see the method applied to today's games, our MLB home run picks today hub runs the full board every day. And the process is portable: the same price-first discipline carries straight into NFL player props when football season rolls around. It is 21+ and legal only where regulated, so bet responsibly.
Want to find home run props priced in your favor without doing the math by hand? OddsShopper pulls the fair, de-vigged price for every dinger and flags the ones offered at a better number. Try it free for 7 days, then code HRPROPSEDGE20 is 20% off OS Pro or OS Core, less than a coffee a day to stop taking the short price on a bet you were making anyway.
More on this: Mariners Vs Astros Home Run Picks Today (8/14) · MLB Home Run Picks Today: Cardinals Vs. Cubs (8/14) · MLB Home Run Picks Today (8/19): Shohei Ohtani & More · MLB Home Run Leader Odds: The Rockies Bat Kalshi Ignores · MLB Home Run Cheat Sheet: Kalshi & Polymarket Contracts (August 19, 2026)
Frequently Asked Questions
What is an MLB home run prop bet? It is a wager that a specific player will hit a home run in a given game. It pays plus-money odds (a price like +450 or +525) because a homer in any single game is a longshot, and the price reflects how unlikely the book thinks it is.
Are MLB home run props worth betting? They can be, but only at the right price. The bet is worth it when your read on a hitter's true home run chance is higher than the chance the odds imply, not just because you like the hitter. The +525 example above is the whole logic in miniature: the price implied 16%, and the hitter's power profile, the fastball-heavy starter, and the park said the real chance was higher. That gap is what "worth it" means. Bet them as small, high-variance plays and judge them over a long sample.
What stats predict home runs best? On the hitter side:
- Barrel rate, hard-hit rate, and launch-angle sweet-spot rate (how often he squares the ball up).
- ISO and expected ISO, for raw and luck-adjusted power.
On the pitching side, the starter's hard-contact rate allowed and how much damage he gives up on his most-used pitch matter most.
How do I find +EV home run props? Translate the price to an implied probability, estimate the hitter's real chance from the matchup and park, and bet only when your number is higher. OddsShopper de-vigs the market to an estimated fair price and its Portfolio EV view flags when a prop is priced better than that number before you bet.
How much should I bet on home run props? Less than you bet on shorter-odds plays. Because these are high-variance longshots, size them as a small fraction of your bankroll, size to the size of your edge, and never chase a cold streak with bigger stakes. The operators partly enforce this for you: on the show behind this article's worked example, the app capped the host at $25 on a single player, so a sizing plan built on small stakes matches how these markets actually work.