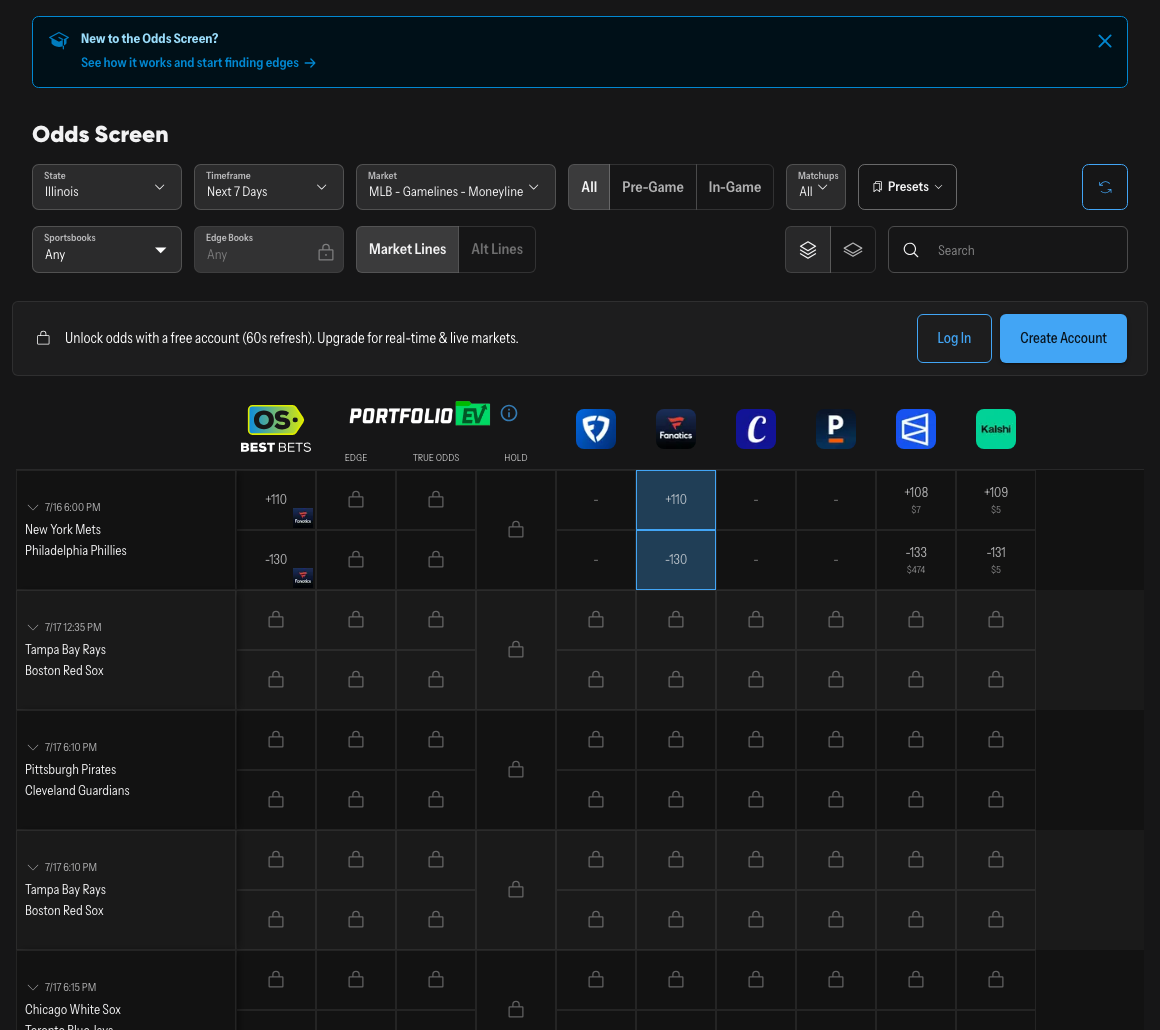
 The OddsShopper live odds screen — every book's price on one board, refreshed in real time. Open the live board.
In Summary (TL;DR)
Good MLB betting research is not a hunt for winners. It is a hunt for prices, full stop. On the 6/15 episode of the OddsShopper "Live With Lindy" MLB Research show, host Eric Lindquist walked through a full 10-game slate and kept coming back to one idea: the price beats the name on the jersey, every time. He passed on every moneyline because the market was too efficient to touch, sized a +1200 home run longshot tiny, and built most of his card around batting order and closing-line value rather than gut feel. This recap breaks down the exact process so you can copy the method, and shows where the OddsShopper odds screen does the same price-checking work automatically.
Watch: The 6/15 Live With Lindy Research Show
The full data deep dive is embedded above. One sentence of context before you copy the method: this is the research episode, so most of the runtime is host Eric Lindquist on screen pulling up splits, projecting lineups, and explaining out loud why each number was a bet or a pass. Watch on YouTube.
The One Rule Behind Every Play: Bet The Price, Not The Team
The thread running through the entire broadcast was that a bet is only as good as the number you get on it. A hot hitter at a bad price is a pass; a quiet hitter at a generous price can be the bet. It was a principle Lindquist came back to all show: he does not bet players because they are hot, he bets them because he is getting a good price. A Reds infielder had homered in three straight games, and the market wanted him bet again. Lindquist went the other way, because three good days do not change what a fair price should be.
Underneath every one of those calls sits expected value, or EV. A bet is +EV when the price you take is longer than the play's true probability deserves — the same +EV math you can hunt for on the OddsShopper board. Judge it over hundreds of bets, never on one result. He was honest about how that plays out: a great Saturday was followed by a brutal Sunday where most of the card came up empty. Same process, opposite outcome, and the only thing that matters is whether the prices were right when the money went down. That gap between price and result is the discipline the whole method rewards: you grade the number, not the box score.
Project The Lineup Before Anything Else
The single best worked example from the broadcast was a Reds hitter at +700 to hit a home run. The logic had almost nothing to do with whether the guy is "due." It was about where he hits in the order, because batting order is real EV.
Out of the nine-hole, he is likely to lead off an inning against the opposing left-hander he would see the most at least once, maybe twice, and that pitcher gives up his damage on the fastball up. Hitting ninth instead of leading off changes how many plate appearances he gets and which pitcher he faces, and at +700 that difference is enormous. The nine-hole was the most likely landing spot better than 60% of the time, with a small chance to lead off, and that range of outcomes more than covered the price.
This is why lineup projection sits at the front of the research process. Extra at-bats are extra EV on a home run prop; a pinch-hit risk or a demotion down the order quietly kills it. Confirmed lineups dropping in mid-broadcast repeatedly removed the uncertainty on a play that was already +EV at the price, including an Arizona outfielder who was +1200 to homer once he was locked into the lineup.
Find The Outlier Price, Then Strip The Vig
The fastest way to find a beatable number is to compare the same bet across books and apps, then strip out the vig to see the true price. On air Lindquist called this the top-down approach: scan the odds screen for the lines that beat everything else, de-vig them, and you have your edge without modeling a single game from scratch. (The vig is the house's built-in margin — if you want the plumbing, here is how sportsbooks actually make money.)
A clean example was a Diamondbacks infielder priced at +486 to homer on Underdog. That number beat the sharp book, Circa, by more than 60 cents, which put the fair price near +425. Line the two up and the play makes itself:
| The +486 Home Run Read | Price on air | Read |
|---|---|---|
| Underdog (The Generous App) | +486 | The outlier, take this |
| Circa (The Sharp Book) | ~+425 | 60+ cents shorter, so ~+425 is fair |
When an app is paying +486 on a player the sharp market pegs near +425, the +486 is the generous outlier, and you take it. You do not need a math degree to spot that; you need the prices side by side. That is exactly what the OddsShopper odds screen and its no-vig, fair-odds pricing are built to do: the odds screen lines the same market up across every book in one view, and the +EV screen strips out the vig to show the fair price next to the offered one, so the manual line-shopping that ate up Lindquist's prep happens for you.
New to OddsShopper?The OddsShopper odds screen scans every major sportsbook and app and flags where a price is longer than the true odds deserve, the same outlier-hunting the show does by hand. Code LINDY25 takes 25% off your first week or month of OddsShopper Pro: start your free trial.
Get Down Before The Line Sharpens
A lot of the edge on the card came from getting down early, before the market sharpened. A starting pitcher's under 3.5 strikeouts opened at +105, in his words a horrific opening line that begged to be hit, so he fired before the number could correct. Call that closing-line value, or CLV: if the price you took looks better than where the market closes, you got down ahead of the move.
CLV is the cleanest scoreboard for a research process, and it is easiest to trust on liquid, efficient markets like moneylines and totals, where the closing price is a sharp consensus. A starting pitcher's strikeout prop is thinner, so the cleaner way to read that +105 under is as a stale-opener edge: the line opened soft, he hit it, and it moved his way afterward, which is CLV showing up on the scoreboard. No one can promise a winning day. What a disciplined process can do is consistently get money down at good numbers, and across a season those few extra cents of price compound into the difference between red and black.
Sometimes The Sharp Move Is No Bet
The most underrated move on the broadcast was a non-bet. Across all 10 games, not a single moneyline came back worth playing. Sorted by edge, the whole board read efficient, so the call was simple: do not give out garbage just to have action.
This is the part most bettors get wrong. Moneylines, spreads, and totals are the most liquid markets on the board, which means the books are sharpest there and the prices are hardest to beat. Not every game has a side. Forcing a play in an efficient market is how an edge bleeds away. He did slab one total he liked, an Angels game under 9, purely because it carried roughly a 2.5% edge, and mixing in a total alongside the props is also how he keeps accounts healthy, but the edge was the reason to fire it. The discipline to pass on everything else was the lesson, and it is why scrolling the free expert picks board on a dead night beats manufacturing a play the numbers do not support.
Match The Stake To The Edge
The longshot home run props were tiny stakes, a fraction of a unit, because a +1200 ticket is high-variance by definition. The bigger-confidence plays got more weight, and you could hear him calibrate it live: the strikeout under got "a little bit more than my standard quarter" unit, and he admitted he "probably should have played it for a half unit" given how much he liked the spot. Edge-proportional sizing like that is what keeps a bettor with a real edge from going broke during a normal downswing.
Trust No Single Data Source
Weather is a good example. He aggregates it from several independent sources before trusting a wind read, and on this day one provider badly disagreed with the others on wind direction at a park, in versus out, so he dropped that outlier from the aggregate on the spot. Bad inputs quietly poison good prices, so cross-check every source and cut the ones that fail.
The Card From The Show
For reference, here are the plays the host called on the broadcast, with the exact prices quoted on air. These are his reads at those numbers, not advice, and prices move fast.
| Play | Price on air | Why it was on the card |
|---|---|---|
| Reds Infielder Home Run | +700 | Lineup-order play, facing the lefty he'd see most out of the nine-hole |
| Nationals Outfielder Home Run | +450 | Starter vulnerable to lefty power |
| Athletics Hitter Home Run | +390 | Took +390 with the line still dropping, playing for CLV |
| Diamondbacks Outfielder Home Run | +1200 | Tiny-stake longshot, taken only once the lineup confirmed |
| Cubs Infielder Home Run | +325 | Wind-out spot at a hitter-friendly park |
| Diamondbacks Infielder Home Run | +486 (Underdog) | Top-down outlier: beat the sharp book (Circa) by 60+ cents, landing near +425 |
| Starting Pitcher Under 3.5 Strikeouts | +105 | Taken off a soft opening number |
| Angels Total Under 9 | ~2.5% edge | The only side that cleared the bar on an efficient board |
The row that captures the whole thesis is that +700 home run: a generously priced number the lineup card justified, bet because it was mispriced and not because the hitter was hot. Every other play on the card is a smaller version of that same question, is this number longer than it should be?
You can follow Lindy's full card and updates on Tails, or pull tonight's free expert picks before you build your own.
How To Bet MLB The Smart Way
The whole workflow comes down to one repeatable loop: project the lineups, compare the same market across every book, de-vig to find the true price, take the outliers early, pass when nothing is mispriced, and size to your edge. Grinding that out across a 10-game slate is hours of work. The same job is split across a few OddsShopper tool surfaces: the odds screen lines every book up side by side, the +EV screen strips the vig and flags the outliers with fair-price and xROI, and the In-Game EV screen keeps doing it live once first pitch is thrown. Together they do the price-and-probability part automatically, surfacing the best number across books in real time so you are not the person who wins the bet but left value on the table by betting it at the wrong shop.
The number you get is the edge.OddsShopper compares every MLB market across every major book and shows you the fair price next to the offered one, so you can spot the outliers you would otherwise chase one book at a time. Lock in 25% off your first week or month of OddsShopper Pro with code LINDY25: start your free trial.
More on this: MLB Hit Props Today · MLB Home Run Picks Today (8/19): Shohei Ohtani & More · MLB Picks Hub: Today's Live Boards and Series · MLB Strikeout Props Today · MLB Total Bases Props Today
FAQ
What Is The Most Important Part Of MLB Betting Research?
Getting the right price. The whole method here is built on betting a number that is longer than the play's true probability deserves, not on picking a team or chasing a hot hitter, and you measure it across a long sample rather than a single day.
What Is Closing-Line Value In MLB Betting?
Closing-line value, what bettors call CLV, means the price you took looks better than where the market closes. That is the cleanest sign you got down ahead of the move, and it is easiest to trust on liquid, efficient markets where the closing price is a sharp consensus.
Why Does Batting Order Matter For Home Run Props?
Because batting order decides how many at-bats a hitter gets and which pitcher he faces. The show's marquee play, a +700 home run, was almost entirely a lineup-order read: leading off versus hitting ninth changes the plate appearances enough to swing the value at that price.
Where Can I Follow These MLB Picks?
You can follow Lindy's full card on Tails, and price every market yourself on the OddsShopper odds screen.
Must be 21+ and physically located in a state where betting is legal. Odds and prices move constantly, so confirm the current number before you bet. If gambling stops being fun, call or text 1-800-GAMBLER.